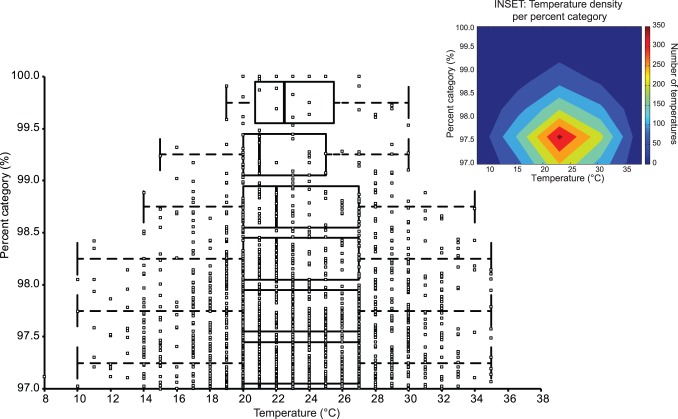
Figure 3. Percent category (PC) depending on temperature: comparison of temperature at different level from 97 PC to 100 PC in 100 m, 200 m, 400 m, 800 m and 1500 m.
Respectively, in each half PC the mean are 23.12°C, 23.49°C, 23.23°C, 22.89°C, 22.63°C and 23.25°C and the median are 23.00°C, 23.00°C, 22.00°C, 22.00°C, 21.00°C and 22.50°C. INSET: Temperature density (ie. number of recorded temperatures) per PC computed over a mesh. The maximal density is computed at 23°C and 97.59% and progressively decreases as PC increase (due to the decrease in performance number). The density decreases as temperature increases or decreases from the maximal density (due to the effect of temperature on performance).

