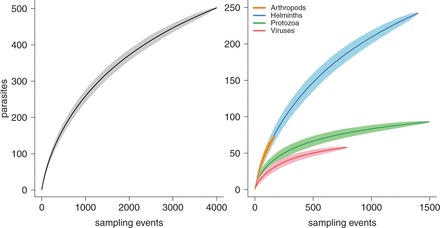
Figure 3.

Parasite species accumulation curve for all 161 primates combined and all parasites (left-hand side). Parasite species accumulation curve for all 161 primates combined and helminths, protozoa and viruses separately (right-hand side). Parasites = cumulative parasite species richness. Arthropods = orange curve; helminths = blue curve, protozoa = green curve and viruses = red curve. For each curve, the darker line shows the mean curve and the lighter shaded region shows 2 standard deviations from the mean curve, each obtained from 1000 random permutations of the data. Note that the axes sizes are different on the left- and right-hand plots.
