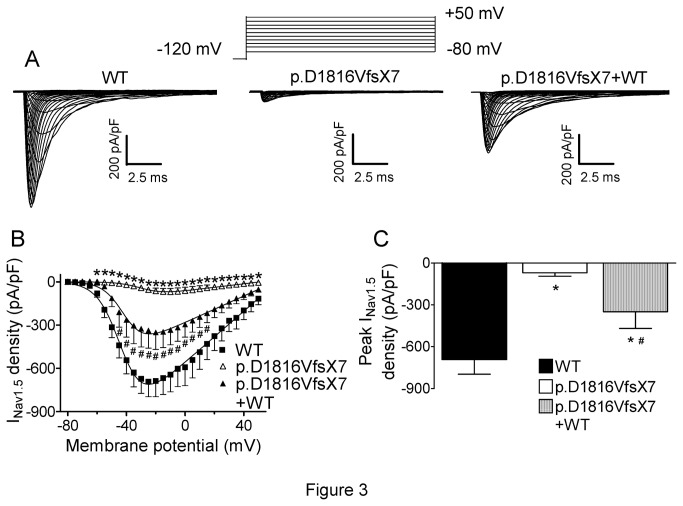
Figure 3. WT and p.D1816VfsX7 Nav1.5 current densities.
A. Current traces obtained by applying the protocol shown at the top in cells transfected with WT, p.D1816VfsX7, and p.D1816VfsX7+WT. B. Current-density voltage relationships for WT, p.D1816VfsX7, and p.D1816VfsX7+WT channels. C. Peak current density generated by each construct tested. Each point/bar represents mean±SEM of >10 experiments. In B and C, *P<0.01 vs WT, and # P<0.01 vs p.D1816VfsX7.

