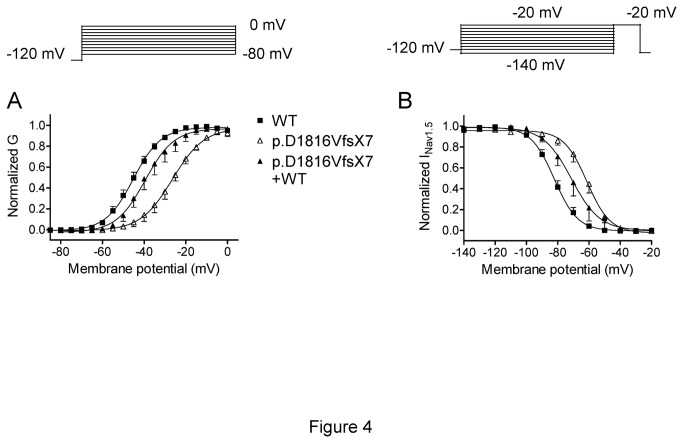
Figure 4. Activation and inactivation voltage-dependence of WT and p.D1816VfsX7 Nav1.5 channels.
(A and B) Normalized steady-state activation (A) and inactivation curves (B) of WT, p.D1816VfsX7, and p.D1816VfsX7+WT constructs. Solid lines represent the Boltzmann fit to data point. Each point represents the mean±SEM of >10 experiments.

