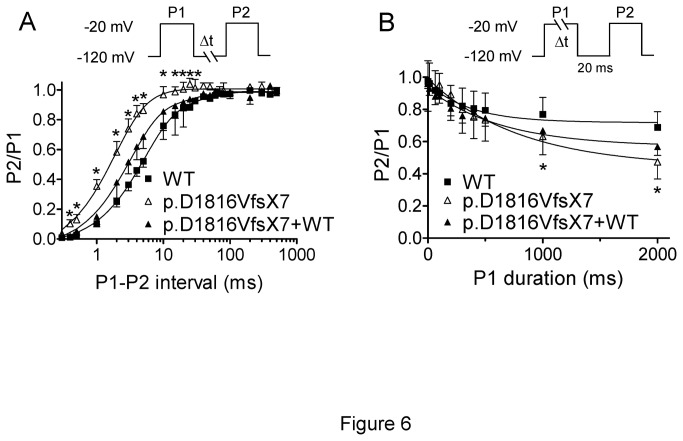
Figure 6. Recovery from fast inactivation of WT and p.D1816VfsX7 Nav1.5 channels.
A. Recovery from fast inactivation of WT, p.D1816VfsX7, and p.D1816VfsX7+WT constructs assessed by applying two 500 ms pulses from -120 to -20 mV (P1 and P2) at increasing coupling intervals (0.1–500ms). Solid lines represent the fit of a biexponential function to the data points. B. Development of slow inactivation of WT, p.D1816VfsX7, and p.D1816VfsX7+WT constructs assessed with the double-pulse protocol shown at the top. Solid lines represent the fit of a monoexponential function to the data points. Each point (ratio of the peak current amplitude generated by P2 and P1 pulses) represents the mean±SEM of >10 experiments and * P<0.05 vs WT.

