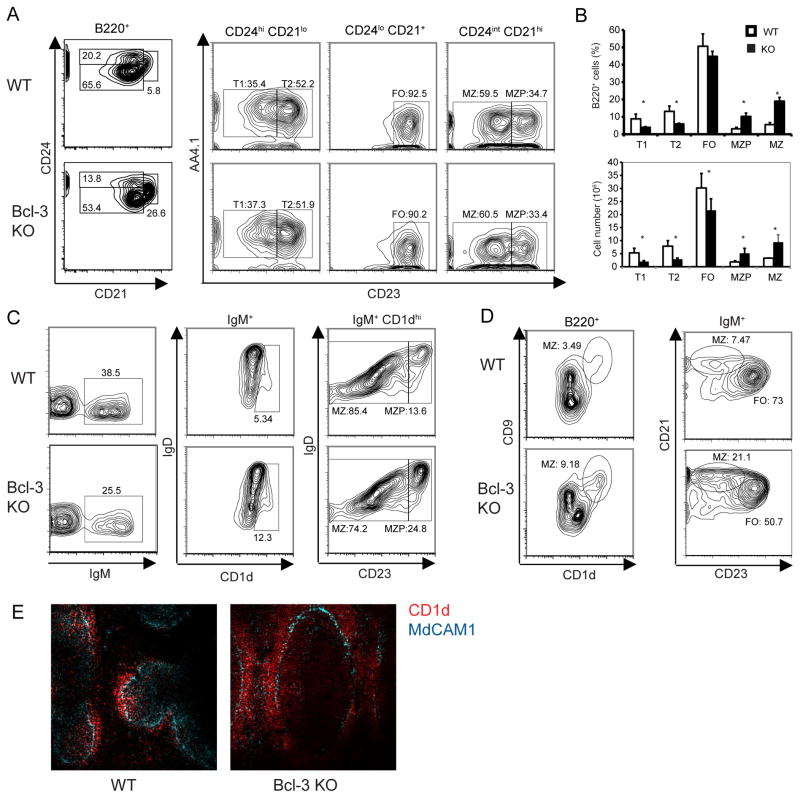
Figure 1.
Bcl-3−/− mice exhibit increased numbers of marginal zone B cells. (A) Representative flow cytometric analysis of splenocytes from 6-week-old Bcl-3+/+ (WT) and Bcl-3−/−(KO) mice, analyzed for surface markers with gates shown across top of panels as indicated. Percentages of B cell subpopulations are shown (T, transitional; FO, follicular; MZ, marginal zone; MZP, MZ precursor). Data are representative of two separate experiments, each with at least n=4 independently analyzed mice per group. (B) Percentages (upper panel) and absolute numbers (lower panel) of B cell subpopulations. Data shown are the mean ± SEM based on a flow cytometric analysis experiment from (A) (n≥4). (*= p<0.05). (C, D) Flow cytometric analyses of splenocytes from mice as in (A), analyzed for expression of surface markers with gates as indicated. Percentages of subpopulations are shown; abbreviations as in (A). Data are representative of at least 2 separate experiments, each with at least n=3 independently analyzed mice per group. (E) Representative spleen section from 6-week old KO and WT mice stained for expression of CD1d and MAdCAM1 shown in colors as indicated. Magnification 20x. Data representative of 2 separated experiments with at least n=4 independently processed mice per group.

