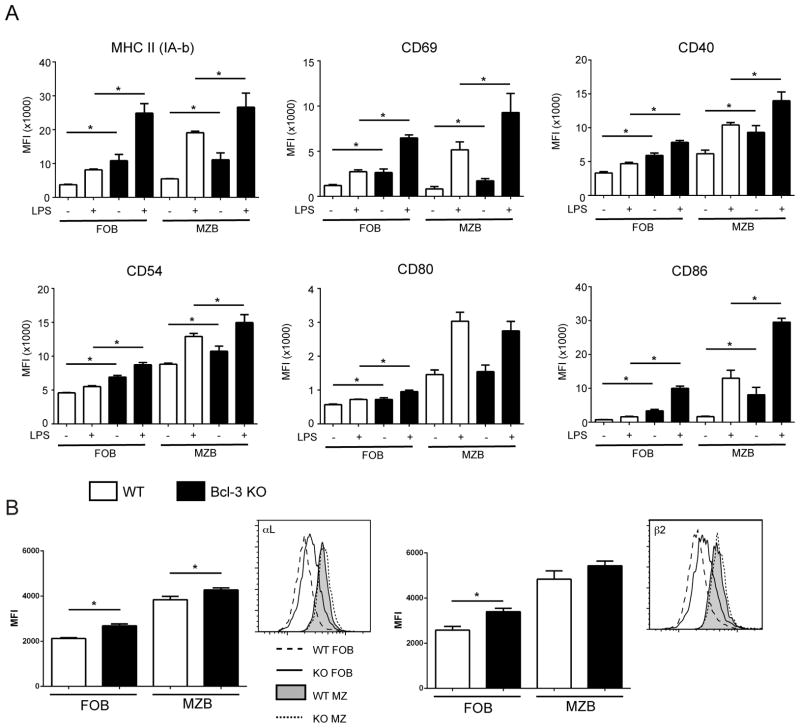
Figure 3.
Expression of co-stimulatory molecules and integrins on Bcl-3−/− B cells. (A) Naïve CD43− B cells were obtained by MACS separation and were stimulated for 24h with LPS (200 ng/ml) or not stimulated (NS). Cells were then analyzed by flow cytometry for expression of surface makers after gating on MZ B cells (B220+ CD1dhi CD21hi, then CD23−/lo) and FO B cells (B220+ CD1d−/lo CD21int, then CD23hi) as indicated. MFI data are shown as mean ±SD of 3 separate experiments with n=8 independently analyzed mice per group. (B) Splenocytes from 6–8 week-old WT and KO mice were analyzed by flow cytometry after staining for B220, CD23, CD21 and the integrin chains αL and β2, as indicated. After gating on MZ B cells (B220+ CD23−/lo CD21hi) or FO B cells (B220+ CD23+ CD21+), expression of integrin chains was analyzed. Representative plots are displayed next to summary MFI data shown as the mean ±SEM for 3 separate experiments, with n=6–8 independently analyzed mice per group. (*= p<0.05)

