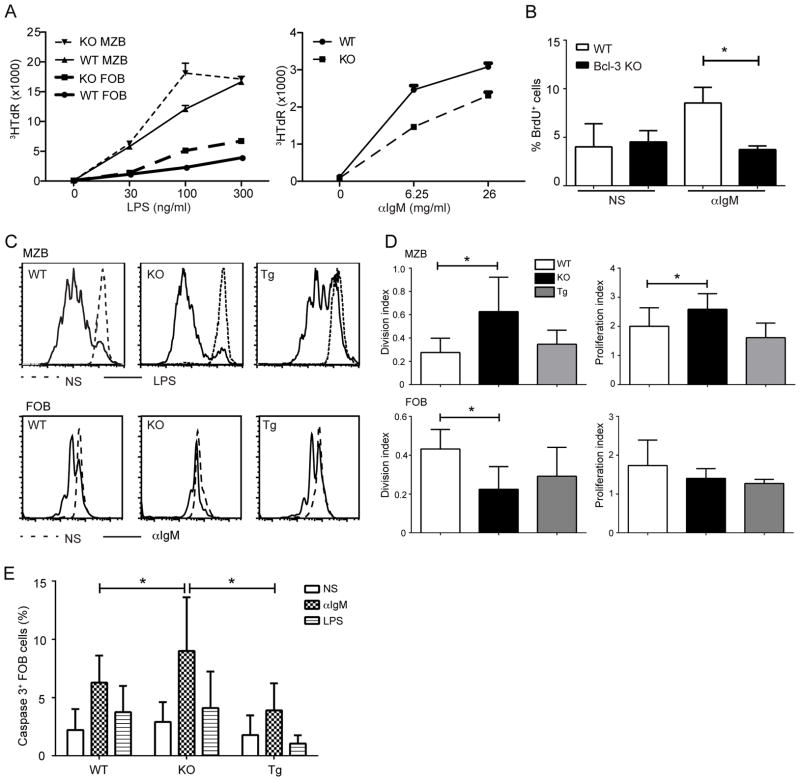
Figure 5.
Bcl-3 differentially modulates BCR- and LPS-induced B cell proliferation. (A) Thymidine incorporation of FO and MZ B cells. Cells were obtained by FACS-sorting from B cells pooled from 4–5 WT and KO mice and stimulated for 72 hours with titrated amounts of LPS (left panel) or anti-IgM (right panel), as indicated, with 3HTdR present during the last 4–6h. Data shown are mean ± SD of triplicate measurements; similar results were obtained in an independent experiment. (B) BrdU incorporation of FO B cells (CD43−CD23+), isolated from WT and KO mice with MACS beads and stimulated with anti-IgM (6.25μg/ml) for 72 hours or not stimulated (NS), with BrdU present during the last 24h. Percentages of BrdU+ cells shown the mean ±SD for n=3 independently analyzed mice. (C) Representative flow cytometric analysis measuring cell division with CFSE dilution. MZ and FO B cells were isolated from WT, KO and Bcl-3 transgenic (Tg) mice as in (A), labeled with CFSE and stimulated for 72 hours with LPS (200 ng/ml) (upper panels) or anti-IgM (6.25 μg/ml) (lower panels), respectively, or cells were not stimulated (NS). (D) Summary of data as in (C) shown as mean± SD for the division and proliferation index (FloJo software analysis) for 3 separate experiments with n=5 independently analyzed pools of mice. (E) FO B cells were isolated as in (B) from WT, KO and Tg mice and stimulated for 48 h with 200ng/ml LPS or 6.25μg/ml anti-IgM or not stimulated (NS), as indicated. Caspase 3 activity was determined by flow cytometry and percentages of cells with activated caspase 3 are shown as mean ±SD from 3–4 separate experiments with n=8 Tg, n=13 WT and n=13 KO independently analyzed mice. (*= p<0.05)

