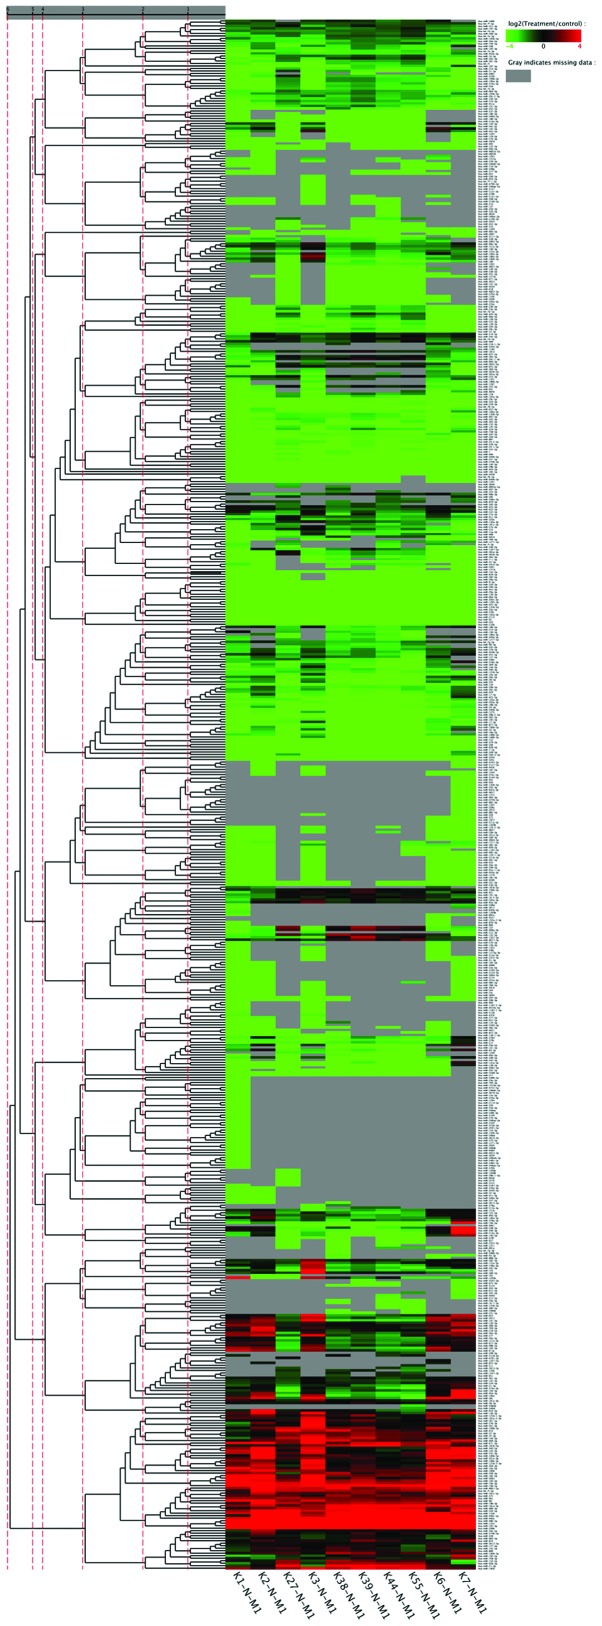
Figure 5.
Heat map cluster analysis of microRNAs (miRNAs). Each row in the figure represents one miRNA. Each column represents one sample pair [one sample from patients with membranous nephropathy (MN) and one sample from normal controls (NC)]. Each cell represents the differential expression of an miRNA in a sample pair.

