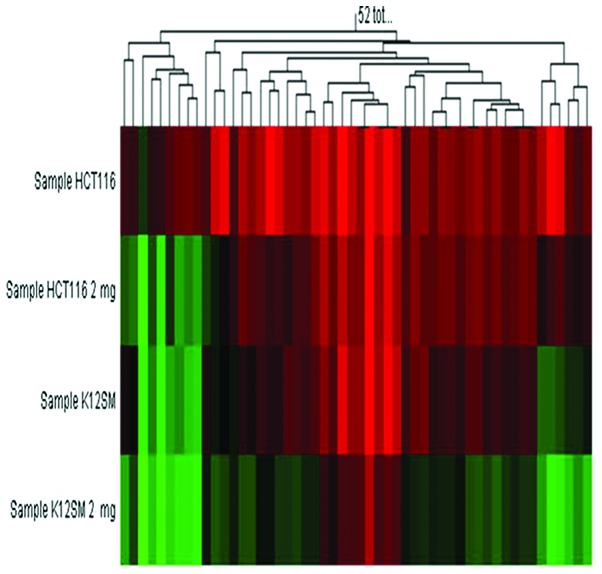
Figure 2.
Multiple clustering analysis of methylation status. Red pixels represent methylation status: the intensities of red pixels depend on methylation status (priority). Greenish black pixels represent unmethylated status. Sample HCT116, before treatment; sample HCT116 2 mg, after treatment with 2 mg of antineoplaston AS2-1 for 24 h; sample KM12SM, before treatment; sample KM12SM 2 mg, after treatment with 2 mg of AS2-1 for 24 h

