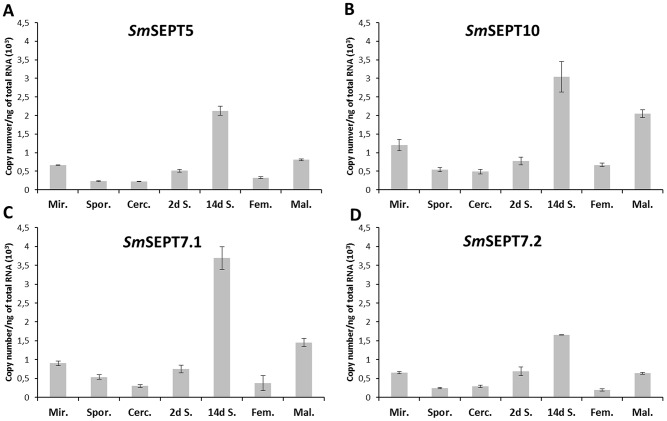
Figure 3. Expression profiles of septins among developmental stages of Schistosoma mansoni.
Expression analysis by qPCR of each of four septins in seven developmental stages of the blood fluke. Panels A to D represent expression levels of SmSept5, SmSept10, SmSept7.1 and SmSept7.2, respectively. Absolute quantification was used to evaluate the expression levels and is presented as copy number per ng of total RNA. Copy number of each transcript was estimated by interpolation of the sample signal from a standard curve for each gene; bars represent standard deviation of the mean of three technical replicates. Mir, miracidia; Spor, sporocyst; Cerc, cercariae; 2 d S, 2 days old schistosomula; 14 d S, 14 day old schistosomula; Fem, adult female; Mal, adult male. (A biological replicate revealed the same trend among stages; Figure S2.)

