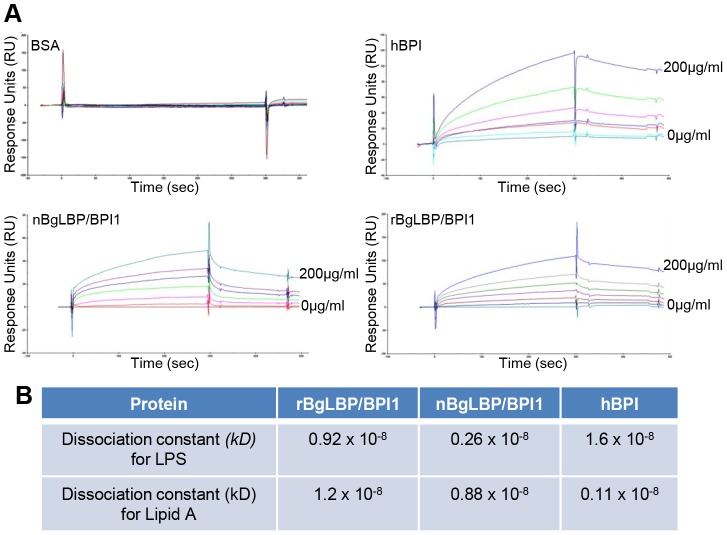
Figure 2. BgLBP/BPI1 bind to LPS and lipid A.
(A) Representative plasmon resonance sensorgrams showing the interactions of BSA (negative control), hBPI (positive control), nBgLBP/BPI1 and rBgLBP/BPI1 with LPS. Purified proteins were immobilized on a CM5 sensor chip and serial LPS dilutions (5, 10, 25, 50, 100 and 200 µg/ml) were injected at a flow rate of 50 ul/min. The responses in RU were recorded as a function of time. Data were fitted to a 1∶1 Langmuir binding model. Similar sensorgrams were obtained with lipid A. (B) Dissociation constants (kD) calculated for each protein.

