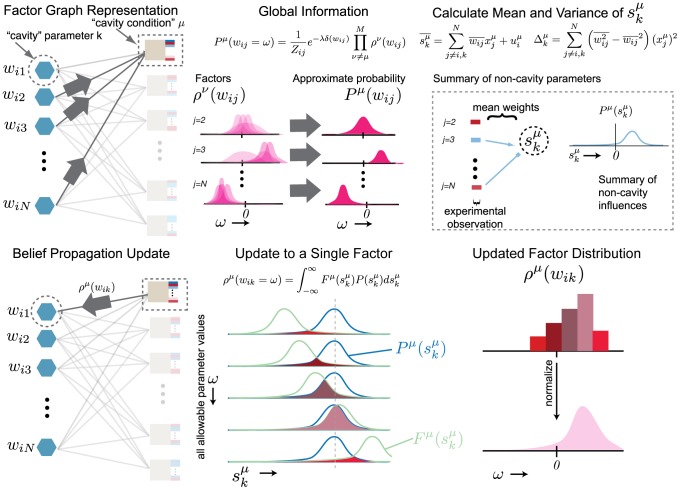
Figure 2. Iteration process for Belief Propagation.
Top panel: the global information consists of collecting the probability distributions of the non-cavity parameters without the contribution from the cavity condition. This is a simple product over all  factors except that from the cavity constraint μ. Distributions centered on zero denote unlikely interactions (see j = 2), centered on the right of zero denote likely positive interactions (see j = 3), and centered on the left denote likely negative interactions (see j = N). These distributions inform the parameters of the Gaussian distribution for the mean-field, aggregate sum variable
  . The distribution
  summarizes the state of the non-cavity parameters. Bottom panel: we calculate the probability of each possible parameter assignment
  to the cavity parameter wik constrained to the data in the cavity condition. This calculation boils down to a simple convolution of the fitness function with a fixed parameter assignment
  with the probability of the aggregate sum variable
  , obtained by integrating over all values of
  . Each assignment
  contributes proportional to the area under the curve. The resulting update is the contribution of condition μ on the distribution of
  , denoted
  . This recently updated distribution becomes part of the global information for successive updates to other parameters.

