
Figure 4. Detailed performance on a single synthetic data-generating network.
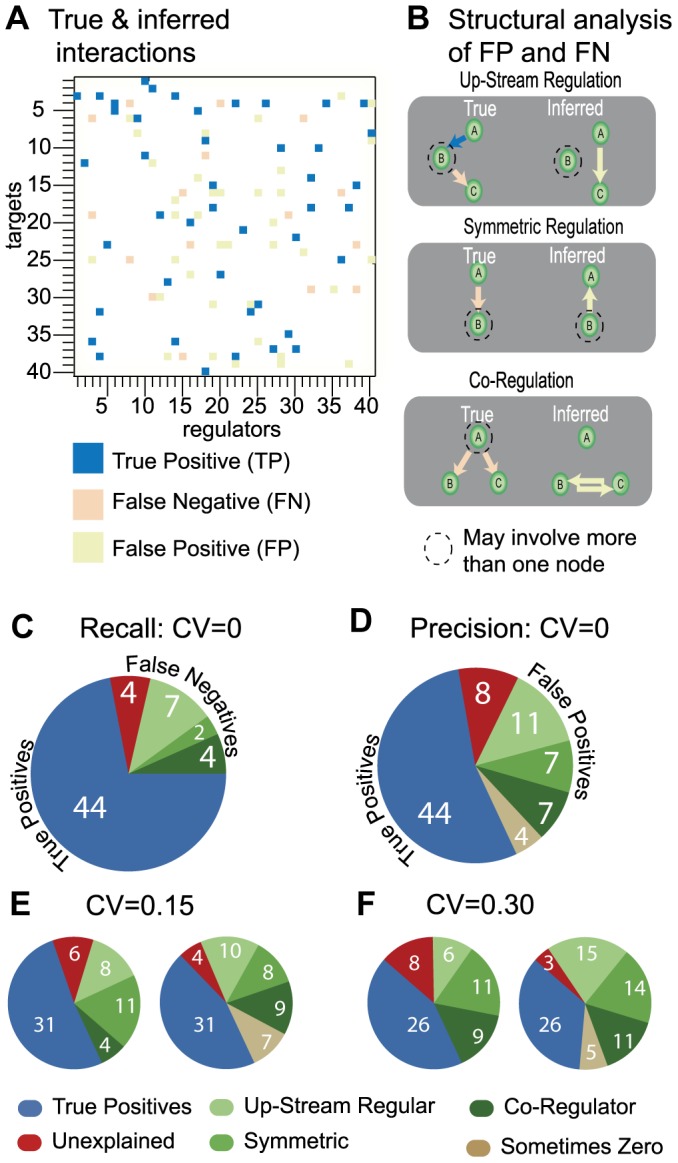
The average parameters from the BP distributions are compared with the true interactions in the synthetic data generator. The color-coded matrix (A) summarizes all inferred and true interactions. While BP recovers many of the true interactions, some of the interactions are missing (orange; false negatives) while others are incorrect (yellow; false positives). We identified three compensatory motifs (B), which relate false positives to false negatives. Collectively, these classes of compensatory motifs contribute to most of the false negatives (C) and false positives (D). In D, we've also included a category for interactions that have a significant probability of being zero (a non interaction). Even in the presence of considerable noise, (E, F) a significant number of interactions are correctly captured and most of the falsely inferred edges participate in compensatory motifs.