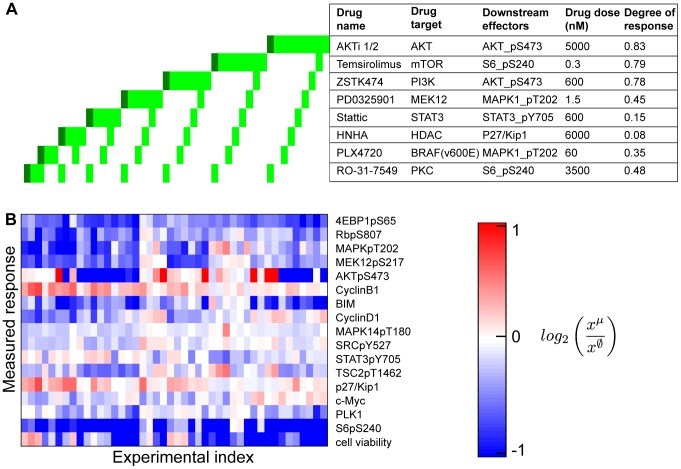
Figure 5. Systematic perturbation experiments.
(A) Perturbation experiments with systematic combinations of eight small molecule inhibitors, applied in pairs and as single agents in low (light green) and high (dark green) doses. The perturbation agents target specific signaling molecules, detailed in the table. The listed drug dose is the standard drug dose (light green), and two times the standard dose was used for the high dose conditions (dark green). The degree of response is the approximate ratio of downstream effector levels in treated condition compared to untreated condition. (B) The response profile of melanoma cells to perturbations. The response profile includes changes in 16 protein levels (total and phosho-levels, measured with RPPA technology) and cell viability phenotype relative to those in no-drug applied condition. The slashed-zero superscript denotes the unperturbed data.

