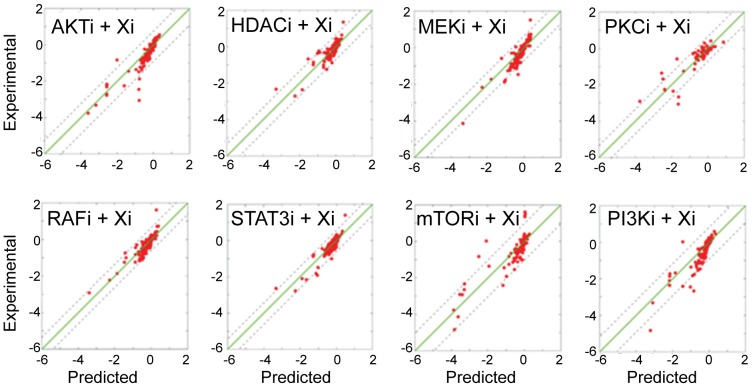
Figure 6. Predictive power of network models.
Eight distinct leave-7-out cross validation calculations indicate a strong fit between the predicted and experimental response profiles. In each cross-validation experiment, network models are inferred with partial data, which lacks responses to all combinations of a given drug. Next, network models are executed with in silico perturbations to predict the withheld conditions. The cumulative correlation coefficient in all conditions between predicted and experimental profiles is 0.87 (CV = 0.05). Few prediction outliers deviate from experimental values more than 1 σ (standard deviation of the experimental values, dashed lines).

