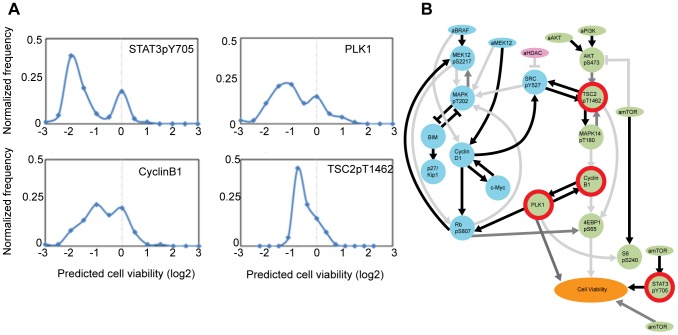
Figure 8. Novel predictions from in silico perturbations.
(A) The histogram of phenotypic response profiles to the four most effective virtual perturbations from the best 100 network models. The response to STAT3p705 reflects the effect of PKCi on cell viability. Viability changes in response to perturbations on cell cycle proteins PLK1 and Cyclin B1 are genuine predictions from the network models. Perturbation of TSC2pT1462 (inhibitory phosphorylation) down regulates the PI3K/AKT pathway and leads to a decrease in cell viability in the PTEN null SKMEL133 cell line. (B) The perturbed nodes that lead to reduction in cell viability in the context of average network model (Circled in red).

