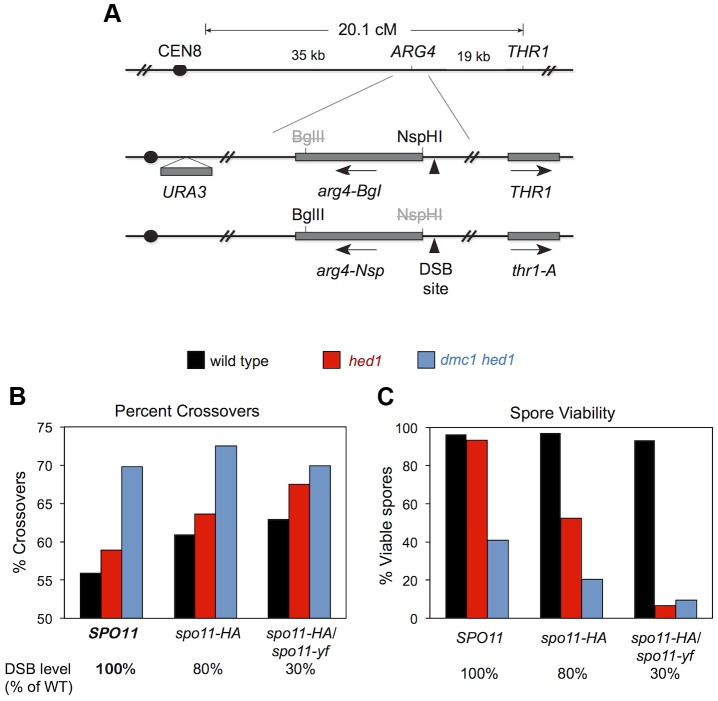
Figure 8. Crossover/noncrossover ratios at ARG4 measured by random spore analysis.
A. Map of the ARG4 region (top) and heterozygous markers used to select ARG4+ gene conversions and determine whether they are associated with crossing over (bottom). B. Percent of ARG4 gene conversions associated with crossing over. C. Percentage of viable spores for the strains analyzed in (B).

