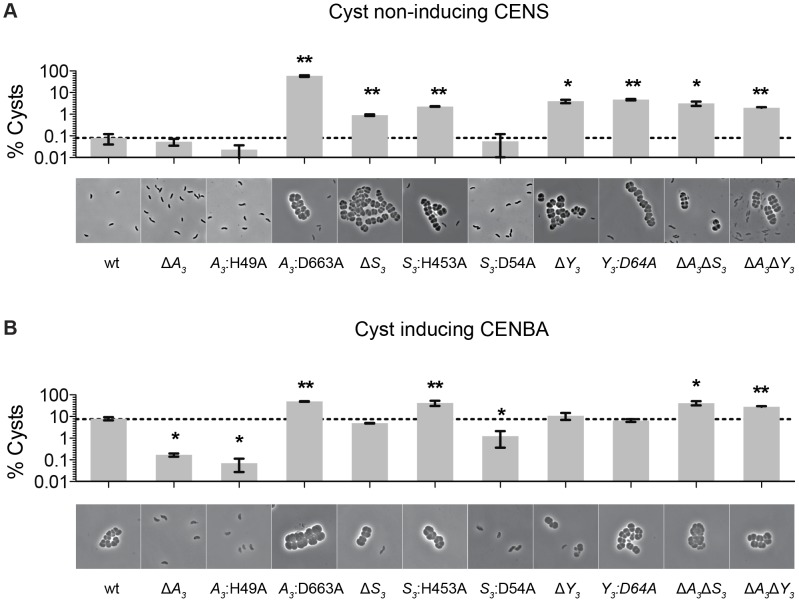
Figure 2. Characterization of cheS3, cheA3 and cheY3 mutants.
The encystment phenotypes of 11 strains including wild type and single, double, and point mutants of cheS3, cheA3 and cheY3 were measured qualitatively by phase contrast microscopy and quantitatively by flow cytometry. (A) Growth on nutrient-rich CENS medium reveals hyper-cyst strains that overproduce cysts relative to wild type. (B) Growth on nutrient-limiting CENBA medium identifies hypo-cyst strains that under-produce cyst cells relative to wild type. Error bars in the bar graphs represent standard deviation obtained from two biological replicates. * (p<0.05), ** (p<0.01) when compared to the wild type (wt) strain in an unpaired t-test.

