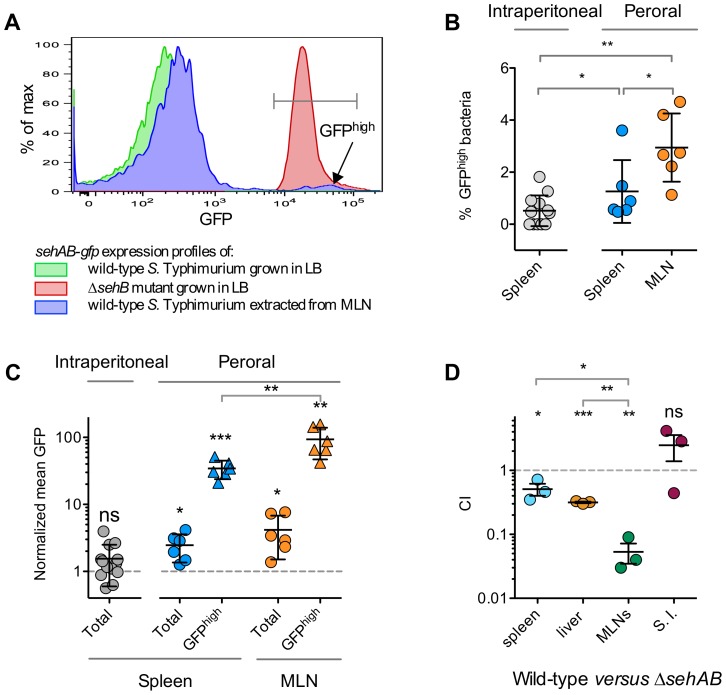
Figure 6. sehAB is highly transcribed in a small population of bacteria upon peroral inoculation.
(A–C) C57BL/6 mice were inoculated intraperitoneally or perorally as indicated with wild-type S. Typhimurium carrying a transcriptional fusion sehAB-gfp. The relative GFP fluorescence intensity of bacteria extracted from the spleen or MLNs was determined by flow cytometry. Between 5000 and 10.000 bacteria were analysed for each sample. (A) A small population of Salmonella extracted from infected mice are highly fluorescent. Bacteria were extracted from MLNs of a mouse five days post-peroral inoculation. Bacteria were analyzed by flow cytometry for GFP fluorescence (blue) and compared to bacteria used for the inoculation (green) and, as control, with a ΔsehB strain (red). Bacteria extracted from MLNs contain a population expressing a high level of GFP (GFPhigh). (B) The percentage of GFPhigh bacteria is significantly higher in mice inoculated perorally versus intraperitoneally. Bacteria were extracted from spleens or MLNs of mice inoculated intraperitoneally or perorally and the percentages of GFPhigh bacteria were determined. (C) The mean GFP fluorescence of total and GFPhigh bacteria is significantly increased in bacteria extracted from perorally inoculated mice and significantly higher in MLN versus spleen. The mean GFP fluorescence was normalized to that of bacteria used for inoculation. (D) The CI of wild-type versus ΔsehAB is lower for the population of bacteria extracted from MLNs. C57BL/6 mice were inoculated perorally with a 1∶1 mixture of wild-type and ΔsehAB strains. Spleen, liver, MLNs and the small intestine (S. I.) were collected five days post-inoculation and bacteria were enumerated. Each symbol represents a mouse, and horizontal bars correspond to the means ± SD. The lowest and highest total CFU/organ in each group of CI were in : spleen, 8.8×10⁶-7.5×10⁷; Liver, 7×10⁷-2.1×10⁸; MLNs, 6.5×10⁴-1.9×10⁵; S. I., 7.1×10⁵-5×10⁶. (B–D) A one-sample t-test was used to determine whether a value was significantly different of one and an unpaired t-tests to determine whether two values were significantly different. P-values: ns, not significant; *, P<0.05; **, P<0.01; ***, P<0.0005.

