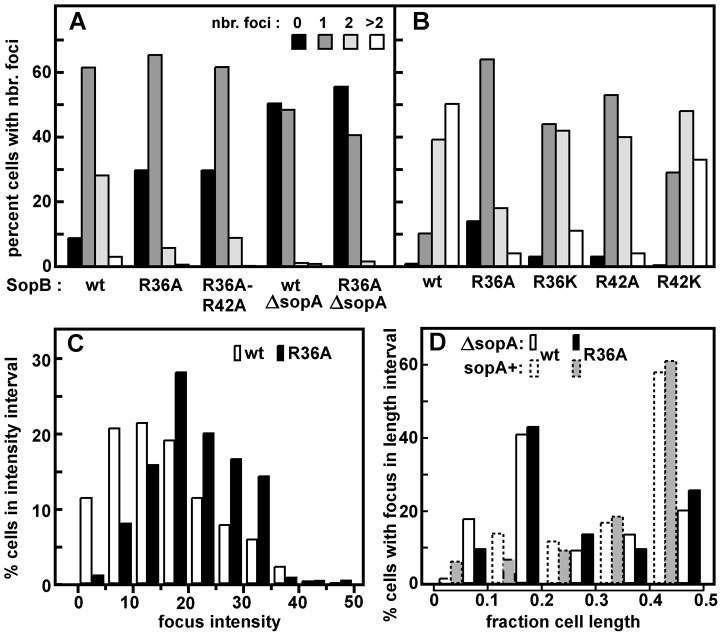
Figure 2. Effect of R36 and R42 mutations on mini-F clustering.
Derivatives of strain DLT2583 (para-tetR::gfp) carrying the tetO-array mini-F, pDAG848, and producing SopA and mutant SopBs in trans were grown in MGC medium (A) or LB broth (B), and the mini-F plasmid foci were visualized as described in Materials and Methods and counted. Total cells scored were: A - 756 (wt), 626 (R36A) 415 (R36A, R42A); 344 (ΔsopA); 368 (ΔsopA, R36A); B - 2118 (wt), 3966 (R36A), 1874 (R36K), 1585 (R42A), 1736 (R42K). The wt and R36A focus number distributions in panel A were shown by the Student t-test to be different at a confidence interval of 95%. Sop protein concentrations relative to wt mini-F were measured by immuno-blot assay to be 1.9- and 2.2-fold (SopA) and 1.7 and 2.4-fold (SopB) higher in cells grown in MGC and LB respectively. C. Brightness of the foci in LB-grown cells, measured using Microbe Tracker. The distributions are different at the 95% confidence level by the Student t-test. Because focus intensity responds non-linearly to plasmid content (as seen elsewhere; e.g. [51]), foci in R36A cells were on average 1.3-fold brighter than in SopB-wt cells while consisting of 2.4 times as many molecules. D. Localization of pDAG848 without SopA. Cells were grown in MGC. The shortest pole-focus distances in single-focus cells were sorted into 1/10 cell-length classes. Dotted-line bars show distributions of single foci in the presence of SopA (Figure 5B). Distributions of focus brightness in ΔsopA cells containing wt and R36A SopB proteins were not significantly different at the 95% confidence level, by the same test as applied to the brightness data of Figure 2C (not shown).

