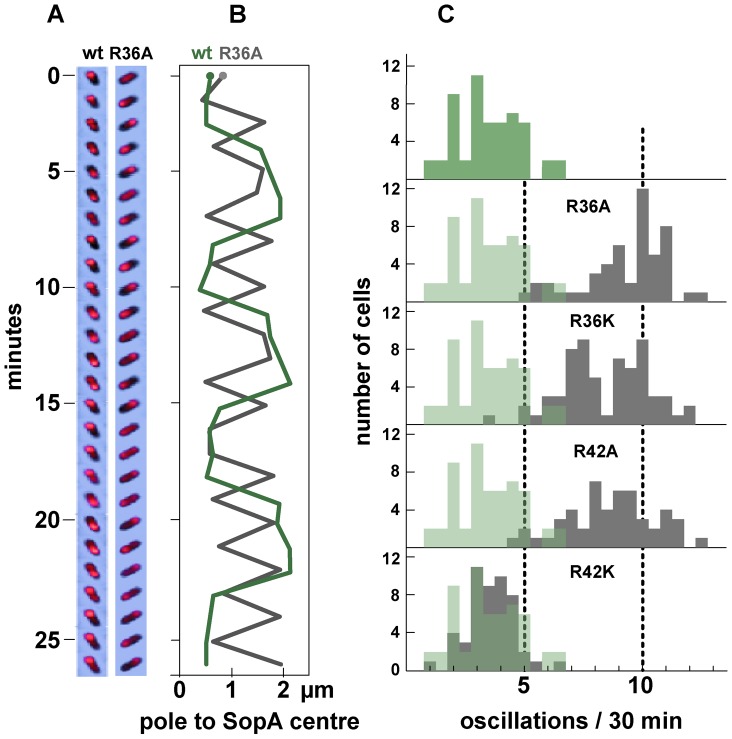
Figure 3. Effect of R36 and R42 mutations on SopA movement.
A. Time-lapse image series of typical DLT2687 (plac-sopA::xfp)/pDAG848 (mini-F)) cells carrying pYAS47 (sopA+B+) or pYAS64 (sopA+B R36A) grown in MGC-IPTG (0.1 µM) medium and applied to MGC-IPTG agarose slides. Images were acquired with an Olympus microscope at 70-second intervals for 29 minutes using 0.5 sec exposure. B. Kymograph of the SopA::Xfp foci in A. Each point represents the position of the brightest pixel in the image. C. Distribution of oscillation rates in cells producing the wt and the four mutant SopBs. Rate data are binned into 0.5 oscillation/30 min intervals. The levels of SopA::Xfp and SopA were, respectively, about 3-fold and 0.3-fold the wt mini-F levels (Figure S1C); repression of the plasmid-borne plac promoter is stronger than that of the chromosomal plac in the conditions used.

