
Figure 4. Dynamics and steady state profiles for the astrocyte/ECS-system.
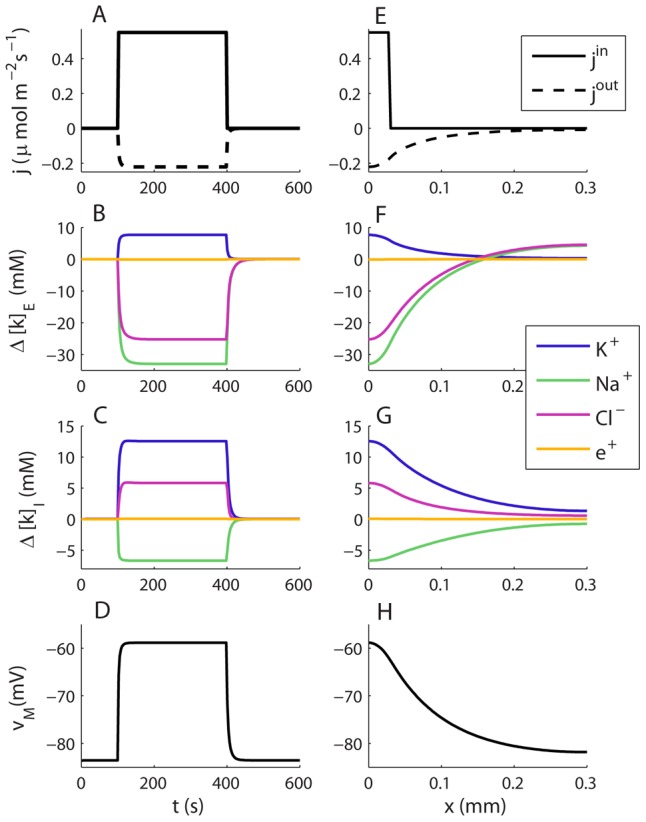
(A–D) Dynamics of selected variables in a point ( ) in the input zone. (E–H) Spatial profiles of selected variables at a time
  , when the system was in steady state. The constant cation-exchange input was applied to the ECS of the input (
 ) zone from
  to
to  . (A) The input and output flux densities of K+ to the point
  . We recall that the Na+ input/output (not shown) was the opposite of that of K+:
  and
and  . (B,D) During the input, ion concentrations in the ECS and ICS changed, but reached steady state after about 10–50 s after stimulus onset. (B)
  (at
(at  ) had then increased by about 7.7 mM with respect to the baseline value. (C)
  had increased by about 12.5 mM due to uptake by the astrocyte. (D) The astrocytic membrane potential had been depolarized to about −59 mV at
  . The impact of the input was smaller outside the input zone. (F–H) Deviations from the baseline ionic concentrations and
  typically decreased with
  . Far away from the input zone (
 ), the conditions were close to the baseline conditions. (B–C, F–G) Ionic concentrations were represented in terms of deviations from resting concentrations:
  for
for  . For direct comparison with ion concentrations, the charge density was represented as an equivalent concentration of unit charges
  .
.