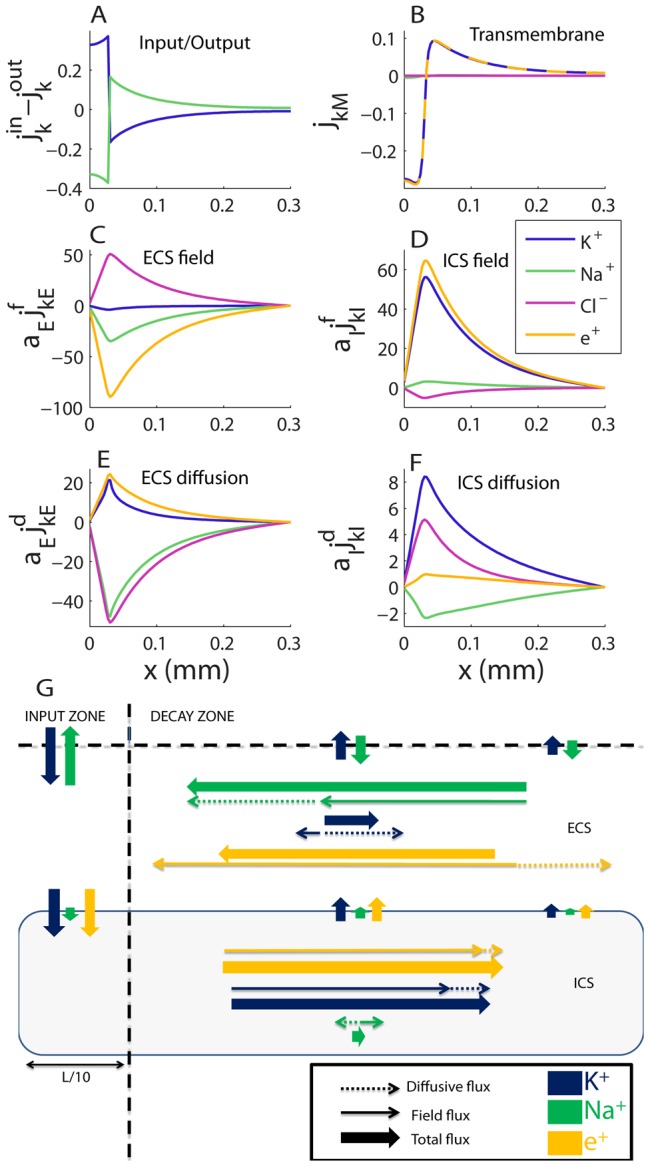
Figure 5. Transports in the astrocyte/ECS system during steady state.

(A) Total flux densities into system ( ). (B) Transmembrane flux densities. (C–F) Longitudinal flux densities due to (C) electrical migration in the ECS, (D) electrical migration in the ICS, (E) diffusion in the ECS and (F) diffusion in the ICS. (A–D) To aid comparison, flux densities
  were scaled by the relative area fraction
  (e.g., if
  ,
,  and
and  carry the same the net flux of ion species
  ). (G) A flow chart that qualitatively summarizes the essential information in (A–F), showing the main transport routes of K+ and Na+ during SS (Cl− excluded from the overview). K+ generally entered the system in the input zone and left the system from some point along the astrocyte axis. The transport route of K+ (from entering to leaving the system) was predominantly intracellular, demonstrating the astrocyte's efficiency as a spatial buffer. Na+ entered in the decay zone and left from the input zone. Na+ transport predominantly took place in the ECS. The illustration (G) is qualitative - longer arrows mean higher flux densities, but the mapping from (A–F) to (G) is not quantitatively exact. The input zone was in the region
  . Units on the
  -axis are
  in all panels.
