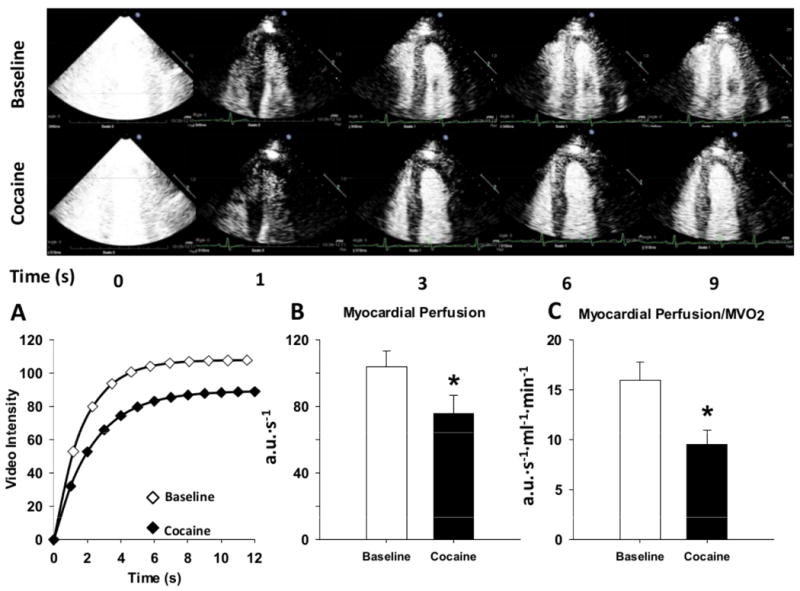
Figure 2.

The myocardial contrast echocardiography response at baseline and following a non-intoxicating low-dose of intranasal cocaine (2 mg/kg). Top panel shows two-dimensional MCE images of the left ventricle of a representative cocaine-naïve healthy subject at various time intervals after the destructive pulse sequence (denoted as T0). Note that with cocaine, the rate of bubble replenishment (β) appears only somewhat reduced, while the maximum video intensity (capillary blood volume) never becomes as bright as the baseline condition. Bottom panel illustrates: A) a typical time-intensity plot obtained at baseline and during low-dose intranasal cocaine exposure, B) summary data showing myocardial perfusion at baseline and in response to cocaine, C) myocardial perfusion normalized to myocardial oxygen consumption (MVO2) at baseline and following cocaine. Summary data reported as mean ± SE. *P < 0.05.
