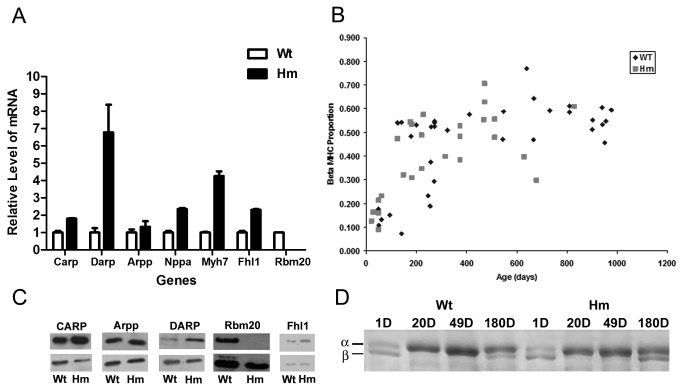
Figure 4. Expression levels of selected genes.
A. Quantitative real time RT-PCR verification of microarray results for selected genes; wild type value set at 1.00 for each gene; all data are from an average of triplicates (P<0.05). C. Western blot analysis of MARPs and Rbm20. B and D. Left ventricle beta myosin heavy chain proportion and electrophoresis with various ages in the different phenotypes. D: day; Wt: wild type; Hm: Homozygote mutant.

