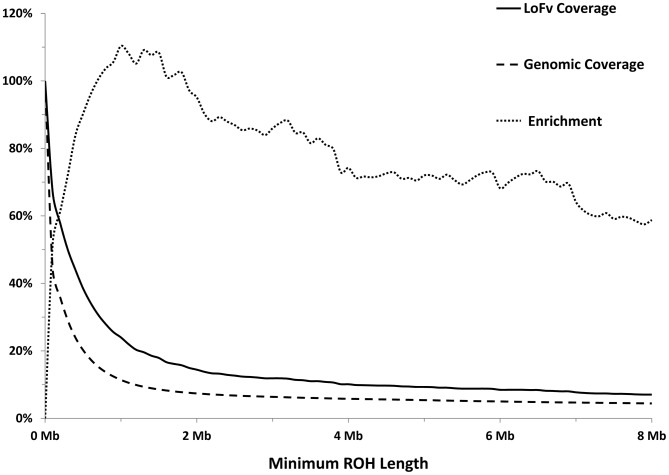
Figure 2. Longer ROHs are more enriched for homozygous LoFs.
Solid line: Percentage of LoFs found within an ROH of indicated length or longer. Dashed line: Percentage of autosomal genome bases included (on average) in ROHs at the indicated length or longer. Dotted line: Percentage of gain in LoF recovery compared to genomic coverage at the indicated ROH length or longer (the percent ratio of the two curves minus one).

