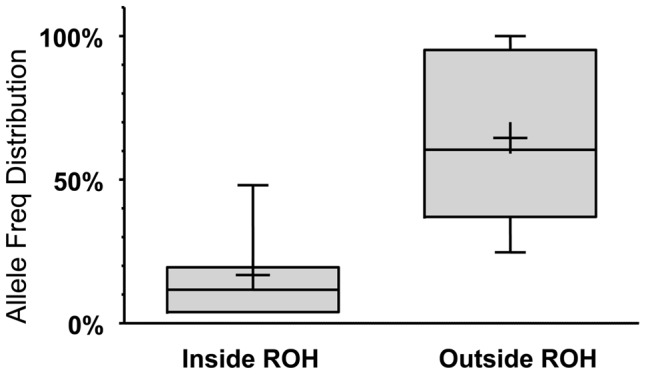
Figure 3. LoF alleles that are significantly biased (at p<0.1 using a one-tailed binomial test, see Text S1 for details) to be within the autozygome (when called at a minimum ROH cutoff of 2MB) are rarer compared to alleles biased to be outside of the autozygome.

The boxes and whiskers represent allele frequency distributions as in Fig. 1. The two groups have a significantly different median at p<0.0005 (Mann-Whitney non parametric test).
