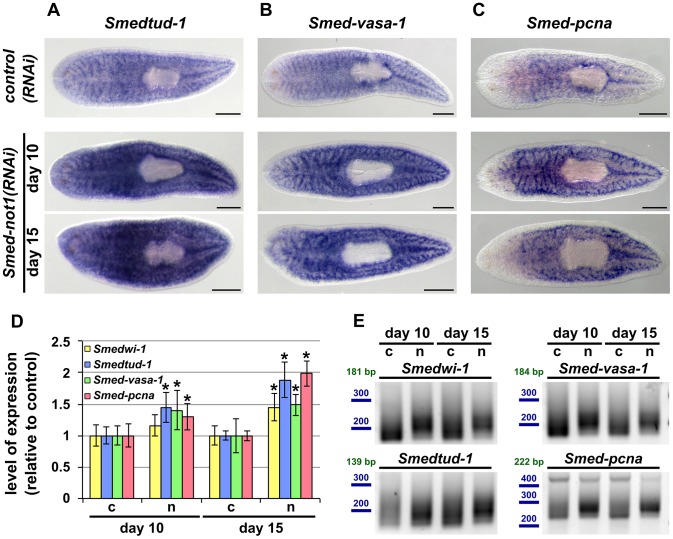
Figure 6. Smed-not1(RNAi) animals have increased levels of neoblast transcripts with increased frequency of long poly(A) tails.
(A–I) WMISH of the neoblast marker Smedtud-1 (A), Smed-vasa-1 (B) and Smed-pcna (C) in control(RNAi) animals (upper panels) and Smed-not1(RNAi) animals 10 (middle panels) and 15 (bottom panels) days after RNAi, showing normal expression of these mRNAs after Smed-not1 knock down, though qualitative differences in the level of expression are suggested. Anterior is to the left. Scale bars: 500 µm. (D) Quantification of the level of expression by qRT-PCR of the neoblast markers Smedwi-1, Smedtud-1, Smed-vasa-1 and Smed-pcna in control(RNAi) (c) and Smed-not1(RNAi) animals (n) 10 and 15 days after RNAi, normalized expression and relative to respective control(RNAi) samples. Error bars represent standard deviation, asterisks represent statistical significance. Smedtud-1, Smed-vasa-1 and Smed-pcna transcripts accumulate progressively after 10 and 15 days of RNAi, while Smedwi-1 only accumulates significantly after 15 days. (E) PAT assays reflecting the distribution of mRNA poly(A) tail lengths for Smedwi-1, Smedtud-1, Smed-vasa-1 and Smed-pcna in control(RNAi) (c) and Smed-not1(RNAi) animals (n) 10 and 15 days after RNAi. Size markers used are represented in blue, the theoretical length of the amplicon corresponding to the deadenylated mRNA species given the primers used in each assay is given in green. Marked differences in poly(A) tail length distribution are detected for all four mRNAs, showing an increased frequency of long poly(A) tails after Smed-not1 knock down.

