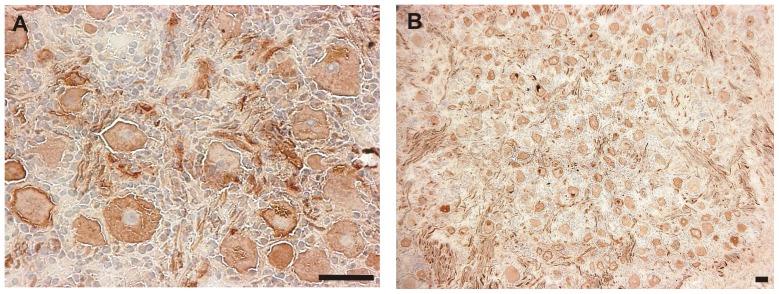
Figure 1. Labeling of a TG with a marker mix of all markers used in the current study (Ret, TrkA, nNOS, RT97, CGRP and peripherin).
The micrograph on the left (A) was taken at 400x magnification for a more detailed view, that on the right (B) at 100x for an overview. Marker proteins are labeled with DAB (brown) resulting in complete labeling of all detected neurons. The tissue was counterstained with haematoxylin. Scale bars represent 50 µm in all cases.

