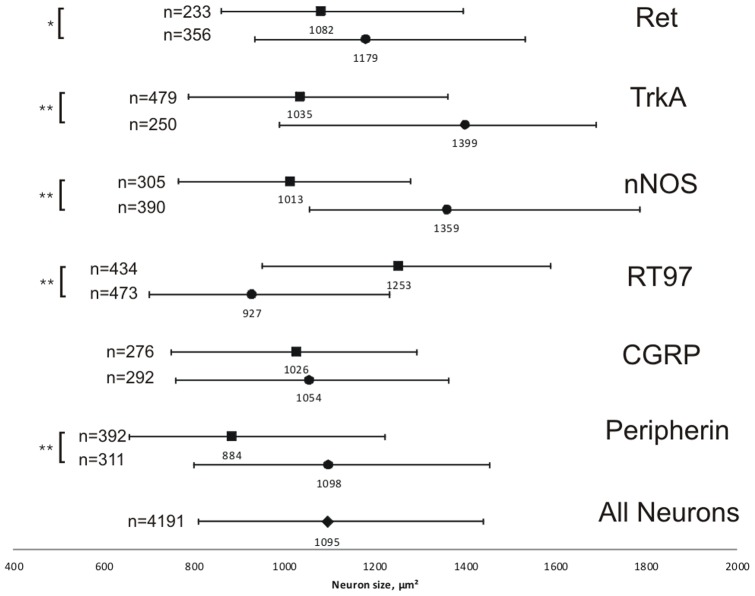
Figure 2. Median cross-sectional areas of cells labeled with different marker antibodies.
Central values represent the median values inµm2, whilst the bars indicate the 25th–75th percentile ranges. Filled squares = marker positive neurons, filled circles = marker negative neurons from the same experiment. n represents the number of counted neurons. Asterisks represent significant differences (* = p<0.01, ** = p<0.001, Mann-Whitney U-test).

