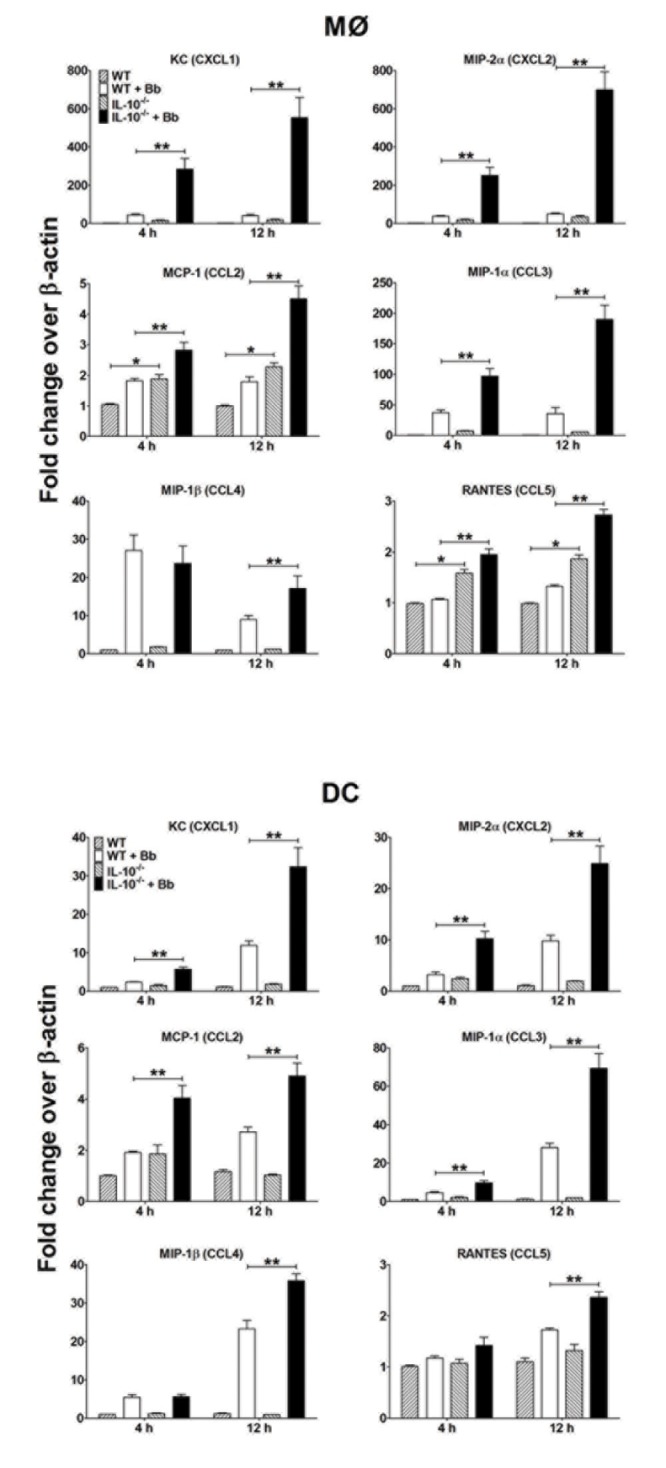
Figure 4. Effects of Bb-elicited IL-10 on chemokine expression by APCs: MØs (upper panel) and DCs (lower panel) from B6 and IL-10-/- mice co-cultured with Bb at MOI=10 at 37°C.

APCs were collected at the indicated times post-stimulation and total RNA was purified and reverse transcribed into cDNA for Q-PCR analyses. The transcript levels of each chemokine are normalized to levels of β-actin for each sample and reported as fold-induced over the baseline values for unstimulated MØs (upper panel) and DCs (lower panel). Each bar represents the average of triplicate samples from at least three separate experiments. Statistically significant values are indicated between unstimulated and Bb-stimulated APCs (*), or stimulated B6 versus IL-10-/- APCs (**).
