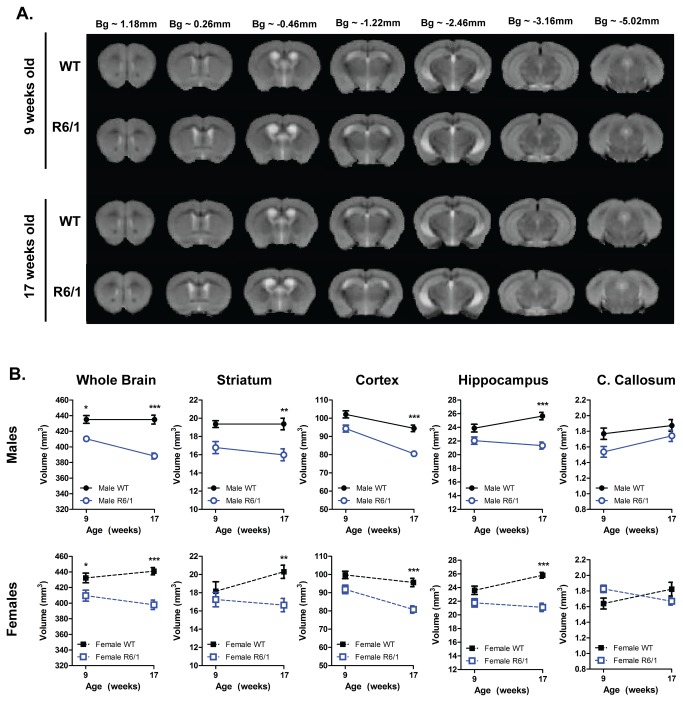
Figure 5. Longitudinal in vivo MRI.
(A) Summed T2-weighted structural group-images from WT and R6/1 mice at 9 and 17 weeks of age. (B) R6/1 mice progressive lost regional brain volumes compared to WT controls, with the exception of the corpus callosum (C. Callosum). Analyzed using a three-way ANOVA (Genotype X Gender X Age). Striatum, cortex, hippocampus, corpus callosum and whole brain: WT male n=11, R6/1 male n=9, WT female n=10, R6/1 female n=9-10. All data presented as means ± SEM; *p<0.05, **p<0.01, ***p<0.001.

