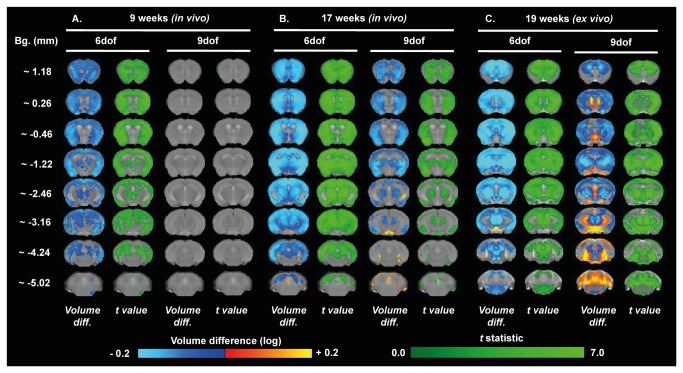
Figure 6. Brain volume changes in male WT and R6/1 assessed through TBM.
Maps of local volumetric changes in male R6/1 mice compared to male WT 9 weeks in vivo (A), 17 weeks in vivo (B), and at 19 weeks ex vivo (C). Images presented as either both global volume change (6 dof), or region-specific changes corrected for global change (9 dof). Color scales are for volume difference (Volume diff., blue-to-yellow), and the raw t statistical value at each voxel (dark-to-light green). Only volume changes and effects-sizes which survive multiple comparisons corrections across all voxels in the brain (False Discovery Rate with q<0.05) are shown.

