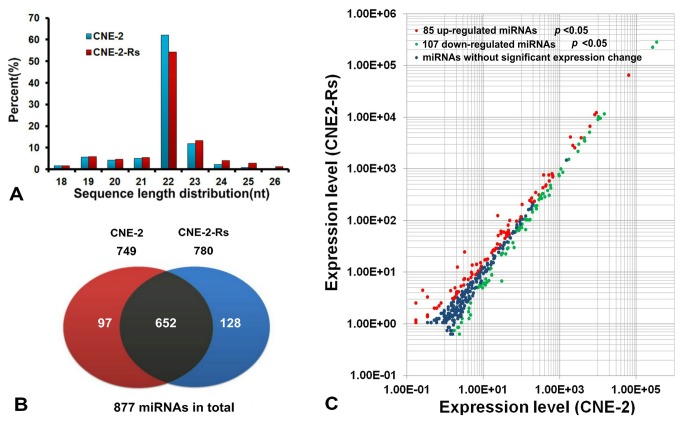
Figure 2. Results of the small RNA information analysis.
(A) The size distribution of the small RNAs in CNE-2 and CNE-2-Rs. The sRNAs with 22 nt had the highest abundance. (B) The miRNAs identified in CNE-2 and CNE-2-Rs. The dark park were the miRNAs found in both samples, the red part and blue part showed the number of miRNAs expressed in sample CNE-2 and CNE-2-Rs, respectively. (C) Scatter plot of miR expression profiles in radiosensitive CNE-2 (x-axis) and radio-resistant CNE-2R cells (y-axis).The up-reugulated miRNAs with statistical significance were marked in red and the down-regulated ones in green (p < 0.05).

