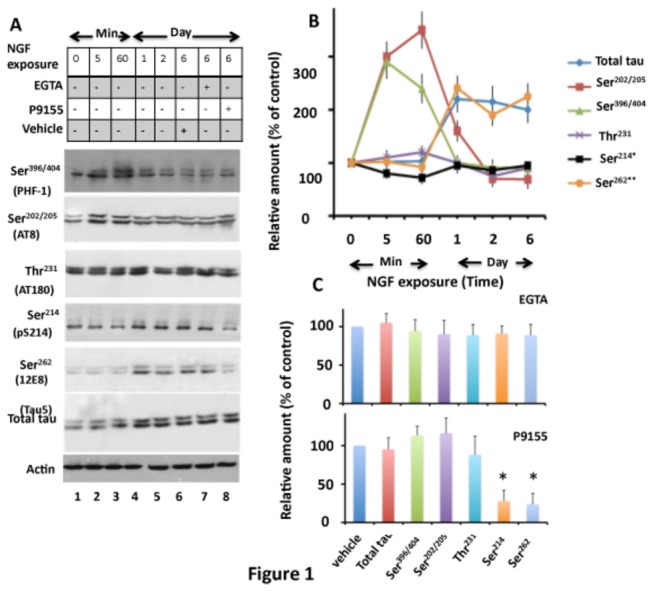
Figure 1. Phosphorylation of tau in NGF-exposed PC12 cells.

PC12 cells exposed to NGF for the indicated time points followed by EGTA or P9115 were analyzed for tau phosphorylation by Western blot analysis. (A) Western blots. (B) Relative amount. The relative amount of phosphorylated tau at each site at the indicated time points was determined by normalizing the band intensity of phosphorylated tau with the respective tau band. The relative amount of total tau was determined by normalizing the tau band to the respective actin band. (C) Effects of EGTA and P9115. Band intensity values of tau or phosphorylated tau at indicated sites in cells exposed to NGF for 6 days and treated with EGTA (panel A, lane 7) or P9115 (panel A, lane 8) were normalized as in panel B and are expressed as the % of vehicle-treated control (panel A, lane 6). Values in panels B and C with standard error are the average of three determinations from three cultures. *p < 0.005 with respect to vehicle-treated cells.
