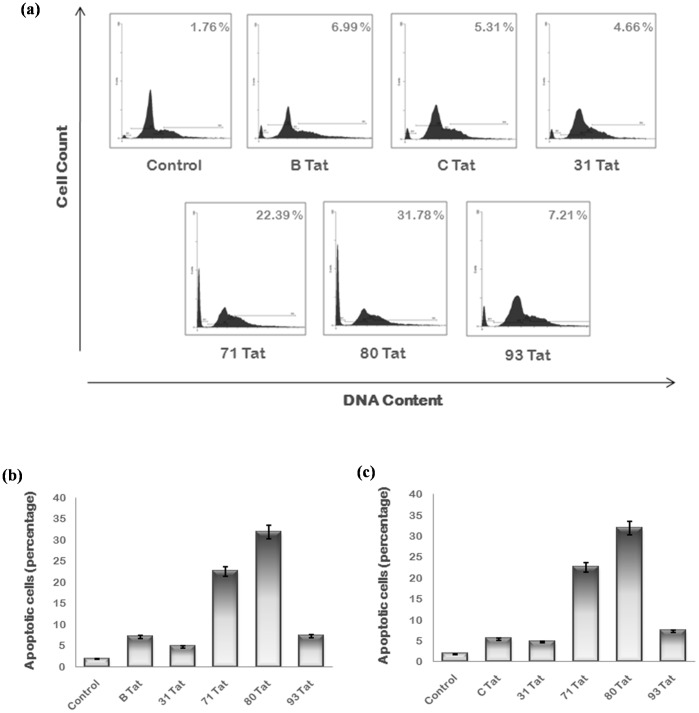
Figure 8. Apoptosis analysis of Tat exon 1 variants.
(a) Hela cells were transfected with 2 µg of each plasmid encoding B Tat, C Tat and Tat exon 1 variants and cells were harvested after 24 hrs using Trypsin EDTA. Cells were then washed with PBS, fixed in 70 percent ethanol, treated with RNase A and stained with PI. After staining, cells were analyzed in PI/RNase solution by flow cytometry. Apoptotic cells were observed as a separate peak before G1 phase. Percentage apoptosis recorded with each variant is shown at the upper right corner. The B/C recombinant Tat 71 and subtype C variant Tat 80 induce more apoptosis then wild type Tat. Results shown here are the representatives of three independent experiments. (b) The percentage of apoptotic cells for each sample was plotted as a bar diagram comparing with wild type B Tat. The p value was less than 0.05 for each sample. (c) The percentage of apoptotic cells for each sample was plotted as a bar diagram comparing with wild type C Tat. The p value was less than 0.05 for each sample.

