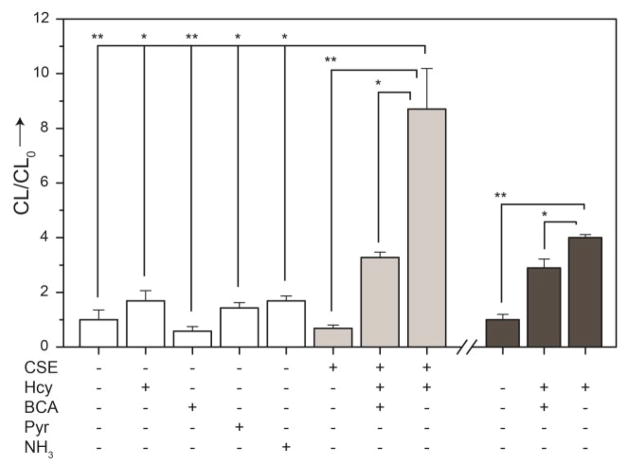
Figure 8.
Detection of CSE-produced H2S using CLSS-2. Conditions: Absence of enzyme (white), 10 μg CSE (light grey), 20 mM Hcy, 20 mM BCA, 25 μM pyruvate, 25 μM NH3; incubated at in 3.0 mL buffer at 37 °C for 48 h prior to detection with 50 μM CLSS-2. Comparison with C6 cell lysates containing 2 × 10⁶ cells (dark grey). Each data point represents the mean ± SE derived from at least 3 independent experiments; * indicates p < 0.005 and ** indicates p < 0.001.

