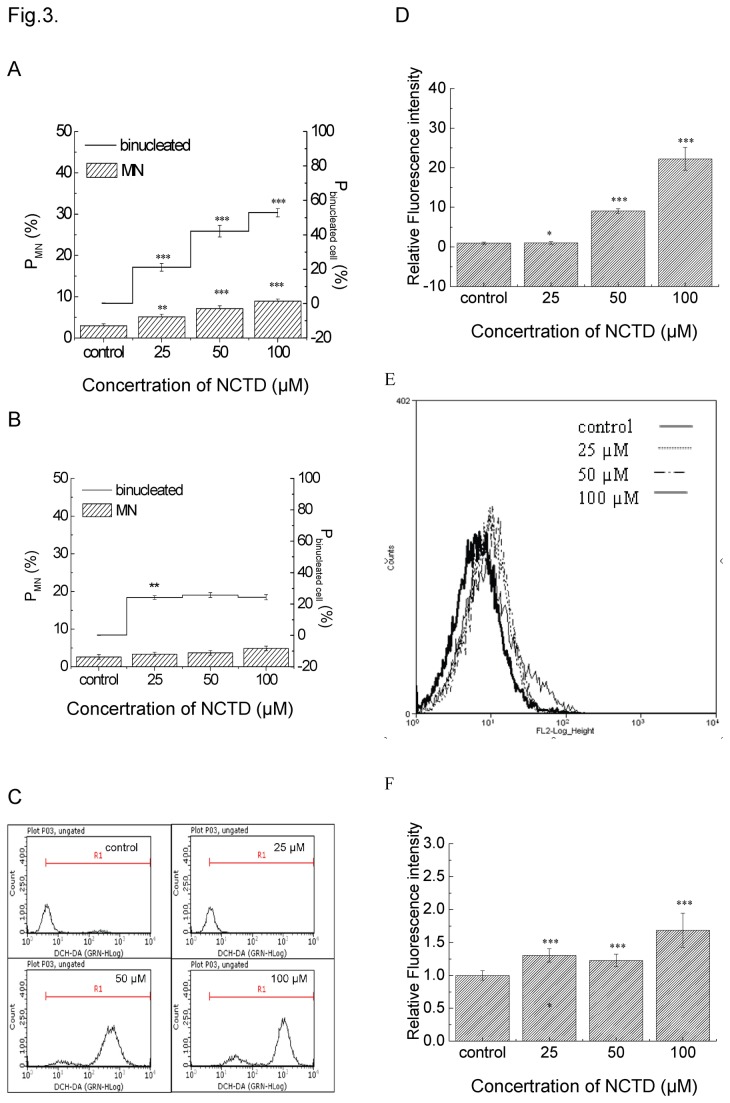
Figure 3. NCTD induced DNA damage and intracellular ROS level.
Plot A, the percentage of cells with MN and the percentage of binucleated cells after NCTD exposure for 24 h. Plot B, NCTD-induced MN was decreased by extrogenerous SOD-PEG. Plot C, DCH-DA fluorescence intensity was measured at 24 h by flow cytometry. Plot D, The values of fluorescence intensity were calculated in different concentration groups. *P <0.05, **P <0.01, ***P <0.001 vs. Control. Plot E, mitochondrial ROS were measured with mitoSox probe. Plot F, the relative fluorescence intensity of MitoSox in the NCTD-treated cells. ***P <0.001 vs. Control.

