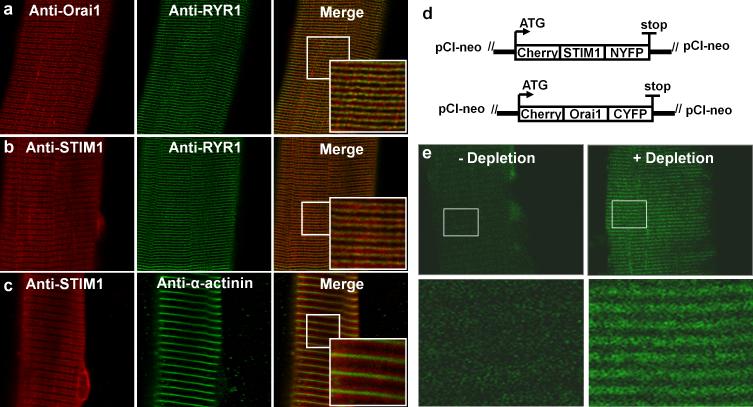
Figure 1. Co-localisation of endogenous STIM1 and Orai1 at the triad junction and formation of STIM1-Orai1 complexes upon store depletion.
(a) Representative immunofluorescence images of endogenous Orai1 alone (left), RyR1 alone (middle), and overlay (right) in a FDB fibre from an adult WT mouse. (b) Representative immunofluorescence images of endogenous STIM1 alone (left), RyR1 alone (middle), and overlay (right) in a FDB fibre from an adult WT mouse. (c) Representative immunofluorescence images of endogenous STIM1 alone (left), α-actinin alone (middle), and overlay (right) in a FDB fibre from an adult WT mouse. Scale bars: 10 μm for low magnification images and 2 μm for high magnification images. (c) Schematic maps of split YFP constructs used in BiFC experiments. The N-terminal fragment of YFP (1-158) was fused to the C-terminus of cherry-tagged STIM1 (left) and the C-terminal YFP fragment (159-238) was fused to the C-terminus of cherry-tagged Orai1 (right). (d) (Top) Representative images of YFP fluorescence in FDB fibres expressing Cherry-STIM1-NYFP and Cherry-Orai1-CYFP before (left) after (right) TG-induced store depletion. Scale bars=10 μm. (Bottom) Higher magnification images in the boxed regions shown in the top panels. Scale bars=2 μm.

