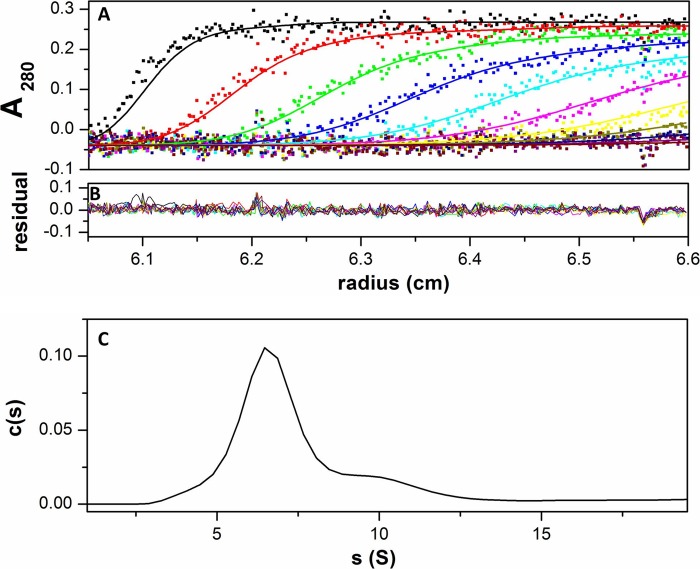
FIGURE 5.
Sedimentation velocity experiment of UCP1 in 1% OG solution. A, the plot shows a superposition of a selection of experimental (dots) and fitted (lines) absorbance profile at 280 nm during ultracentrifugation at 50,000 rpm of UCP1 in OG. Scans were taken every 3 min as described under “Experimental Procedures.” B, superimposition of differences between the experimental and fitted curves. C, sedimentation velocity analysis made in terms of a continuous distribution of species.

