FIGURE 6.
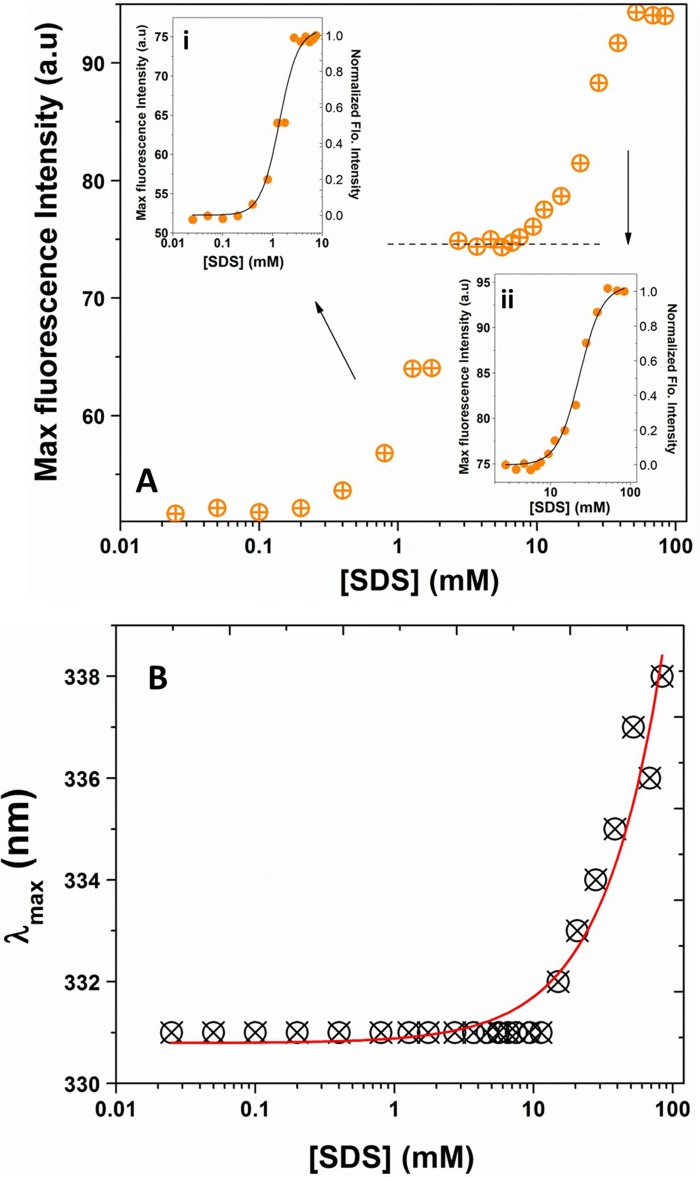
Dissociation of UCP1 tetramers in POPC liposomes by SDS, monitored by Trp fluorescence. A, plot of maximum fluorescence of UCP1 (excited at 295 nm) versus SDS revealed a three-state dissociation process for UCP1 tetramers in lipid vesicles. The inset (Ai) shows the maximum fluorescence intensity of UCP1 in the low SDS region (0–10 mm), interpreted as transition of UCP1 tetramers toward tight dimeric units. The inset (Aii) shows the fluorescence intensity of UCP1 in the high SDS region (5–100 mm), where UCP1 tight dimers could be further dissociated into their loose dimeric and monomeric forms. All values were normalized, and the data were fitted to the Hill equation. The K1/2 for the first and second transitions were 1.3 ± 0.1 and 23 ± 1 mm, respectively. a.u., absorbance units. B, plot of the maximum emission wavelength (λmax) versus SDS revealed no significant change in the maximum Trp emission wavelength up to ∼20 mm SDS, where the fluorophores became more exposed to the polar environments and exhibited a red shift in its maximum emission wavelength.

