
FIGURE 3.
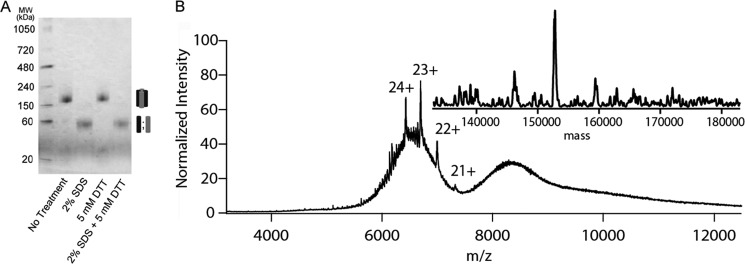
Analysis of the native peripherin-ROM1 complex by blue native gel electrophoresis and mass spectrometry. A, purified peripherin-ROM1 complex was resolved on a 4–16% native PAGE gel and stained by Commassie G-250 supplied in the cathode buffer. Protein was treated with 2% SDS, 5 mm DTT or both just prior to loading on the gel. B, native nanoelectrospray mass spectrometric analysis of peripherin-ROM1 complex displayed over m/z range 4000–12,000. The spectrum was smoothed using wavelet thresholding. A deconvoluted “zero charge” spectrum resulting in a mass of ∼153 kDa consistent with a tetrameric complex is displayed in the inset.