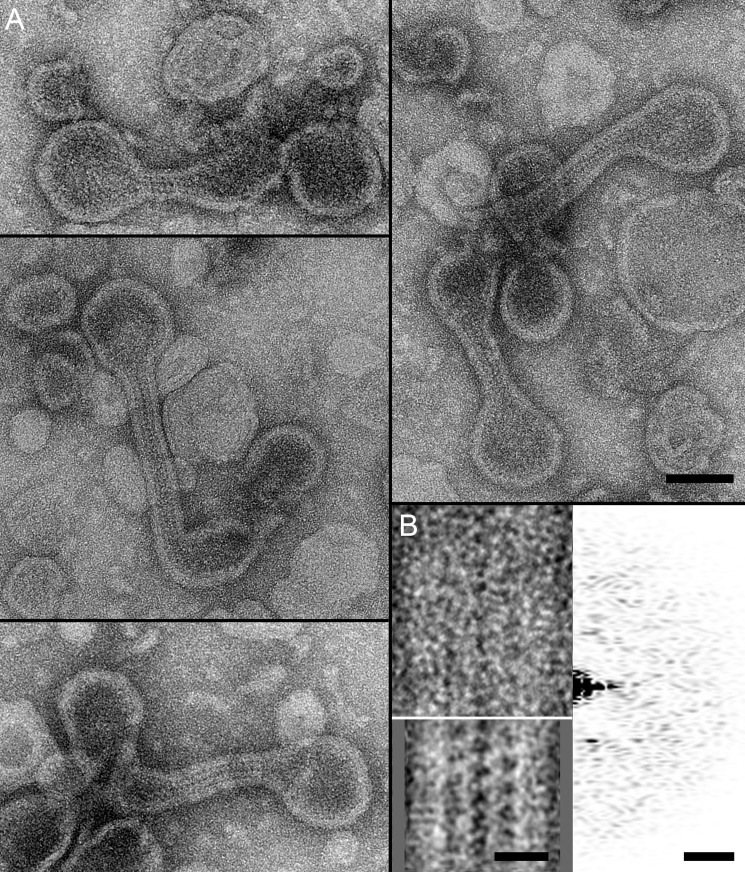
FIGURE 7.
Micrographs of peripherin-ROM1-lipid ribbons. A, representative images of disk-like structures connected by ribbons formed during peripherin-ROM1 reconstitution. Scale bar: 100 nm. B, correlation average from 36 ribbon segments revealed a distinct periodicity (bottom left inset). Scale bar: 20 nm. The unprocessed ribbon segment exhibited a weak periodic pattern (top left inset) revealed in its power spectrum (top right inset). Scale bar: (5 nm)−1. Reconstitution conditions: peripherin-ROM1 (1 mg/ml) was mixed with lipids at a lipid to protein ratio of 1.0 (w/w) in 100 mm NaCl, 5 mm MgCl2, 10 mm Bis-tris propane, pH 7.

