
FIGURE 2.
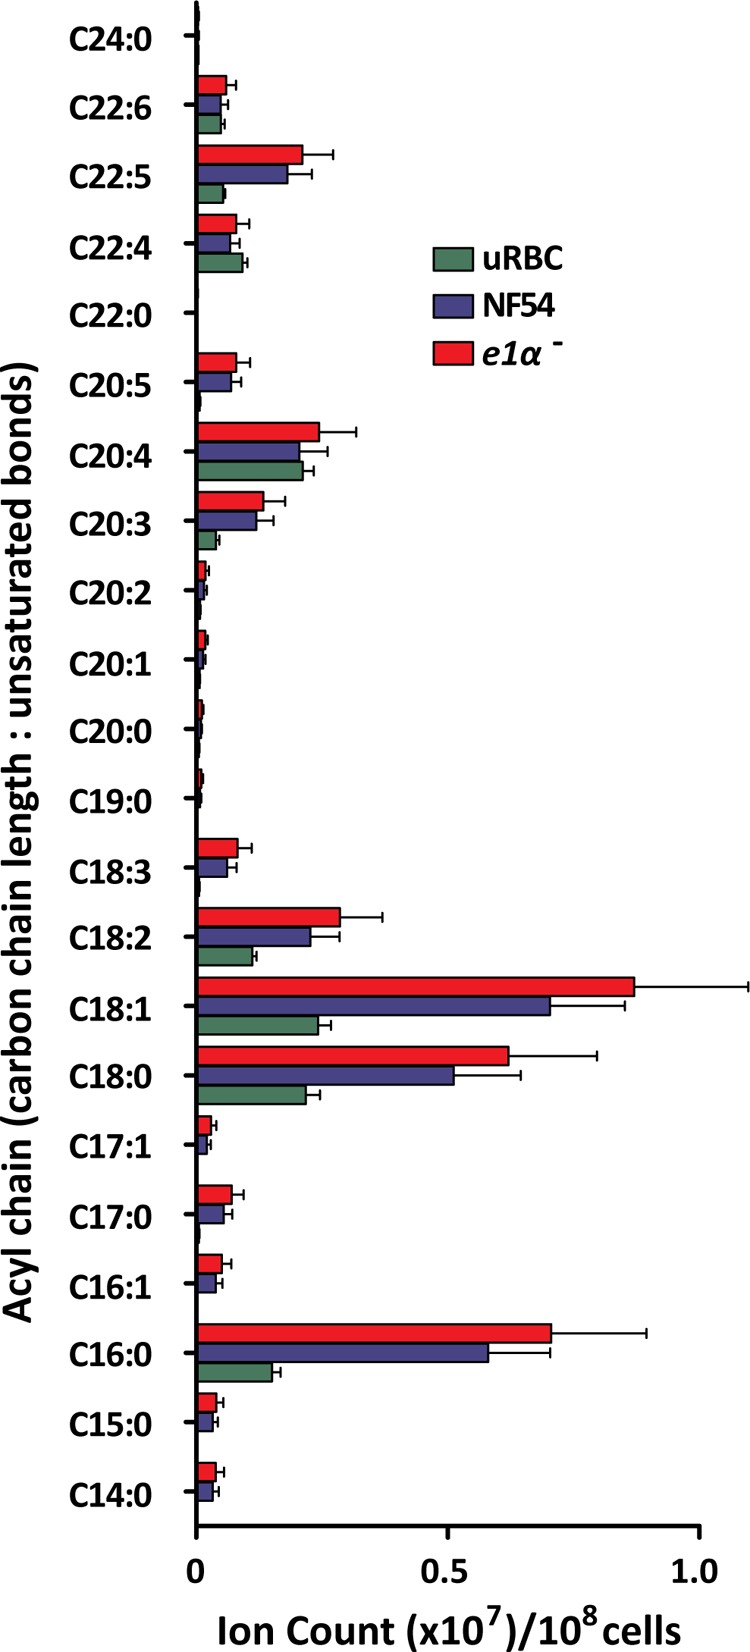
Fatty acid profile of NF54 and pdh e1α- infected erythrocytes in comparison to uninfected erythrocytes (uRBC). Processing blanks were measured and subtracted from the total ion count and signals normalized to the internal standard ([16-13C]palmitate). Data are presented as total ion counts/108 cells mean ± S.E. from n = 3 experiments.