
FIGURE 14.
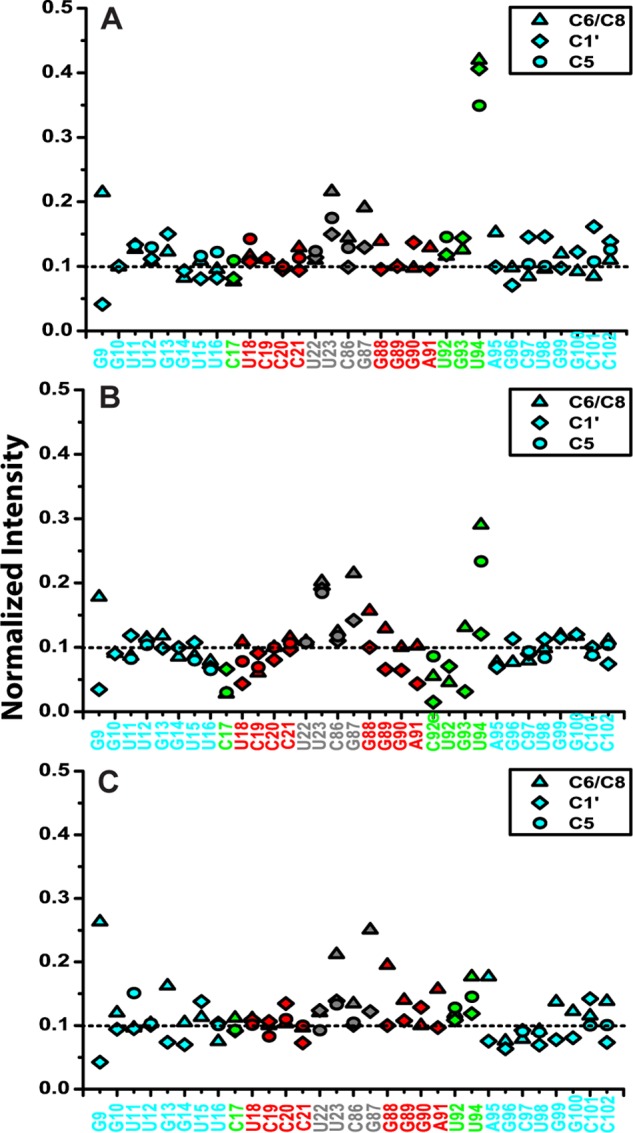
Normalized resonance intensities of WT (A), E+1 (B), and E−1 (C) from non-constant-time two-dimensional 1H-13C HSQC experiments. The nucleotides are colored by subdomain as in the inset of Fig. 11B.
Official websites use .gov
A
.gov website belongs to an official
government organization in the United States.
Secure .gov websites use HTTPS
A lock (
) or https:// means you've safely
connected to the .gov website. Share sensitive
information only on official, secure websites.
Normalized resonance intensities of WT (A), E+1 (B), and E−1 (C) from non-constant-time two-dimensional 1H-13C HSQC experiments. The nucleotides are colored by subdomain as in the inset of Fig. 11B.