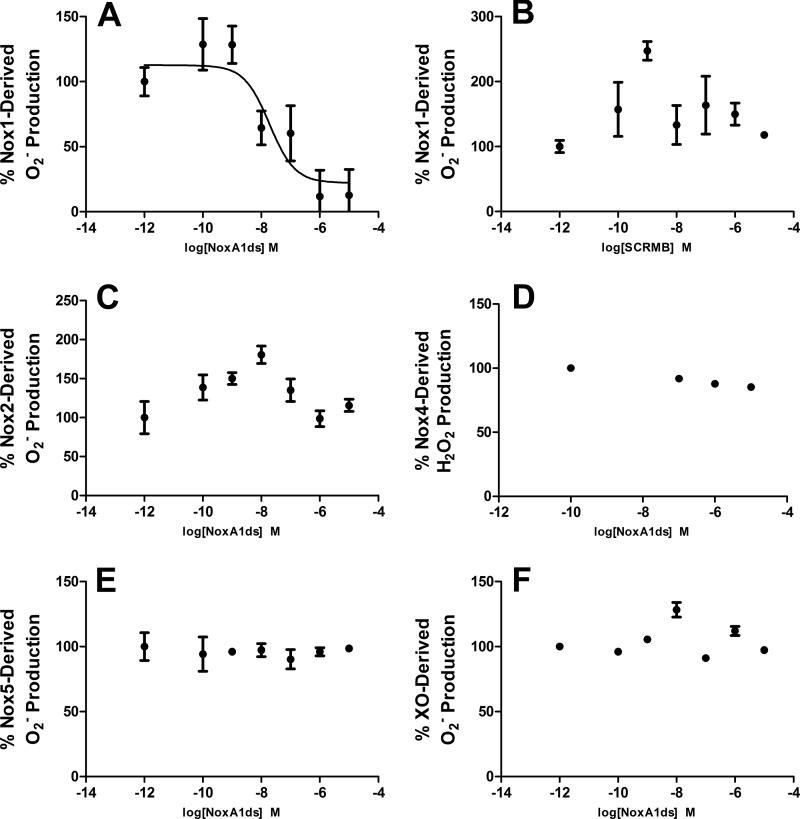
FIGURE 1.
NoxA1ds inhibits nox1-derived O2⨪ but not related enzymes. Production of O2⨪ was calculated by monitoring the reduction of cytochrome c for 15 min post-NADPH addition and subtracting base-line cytochrome c reduction occurring in the presence of SOD. A, production of O2⨪ as measured by the reduction of cytochrome c by cell lysates from COS cells transiently transfected with the Nox1 oxidase. Increasing concentrations (from 0.1 to 10,000 nm) of NoxA1ds caused a dose-dependent inhibition of O2⨪ production with an IC50 of 19 nm. Maximal inhibition of 88% of total O2⨪ production was achieved at a dose of 1.0 μm NoxA1ds. B, increasing concentrations of SCRMB did not inhibit Nox1-derived O2⨪. C, production of O2⨪ as measured by the reduction of cytochrome c by cell lysates from COS cells transiently transfected with the Nox2 oxidase. Lysates were treated with increasing concentrations of NoxA1ds (from 0.1 to 10,000 nm) prior to stimulation of enzyme assembly with 130 μm lithium dodecyl sulfate and enzyme activation with 180 μm NADPH. D, production of H2O2 as measured by Amplex Red fluorescence 15 min post-NADPH addition by membrane fractions prepared from COS cells transiently transfected with the Nox4 oxidase. Lysates were treated with increasing concentrations of NoxA1ds (from 100 to 10,000 nm). E, production of O2⨪ as measured by the reduction of cytochrome c by cell lysates from HEK293 cells stably transfected with the Nox5 oxidase stimulated with Ca2+ as described by Banfi et al. (13) and treated with increasing concentrations of NoxA1ds (from 0.1 to 10,000 nm). F, production of O2⨪ as measured by electron paramagnetic resonance from pure xanthine oxidase enzyme preparations, stimulated with hypoxanthine and pretreated with increasing concentrations of NoxA1ds (from 0.1 to 10,000 nm). In all panels, enzyme activity was evaluated 15 min post-enzyme activation with substrate (20 min post-NoxA1ds treatment), and no inhibition of the signal was observed in B–F. n = 9–12, three to four separate experiments.

