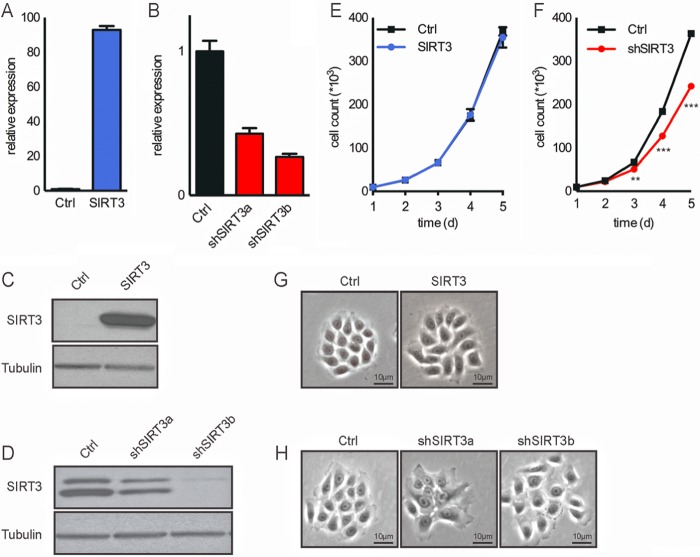
FIGURE 3.
Generation of stable SIRT3-overexpressing and SIRT3-knockdown keratinocytes. Shown are the results from RT-PCR analysis (A and B) and Western blotting (C and D), the proliferation rate (E and F), and microscopic images (G and H) of control (Ctrl) and SIRT3-overexpressing (A, C, E, and G) and SIRT3-knockdown (B, D, F, and H) N/TERT-1 keratinocytes. **, p < 0.01; ***, p < 0.001 (n = 3). d, days.

