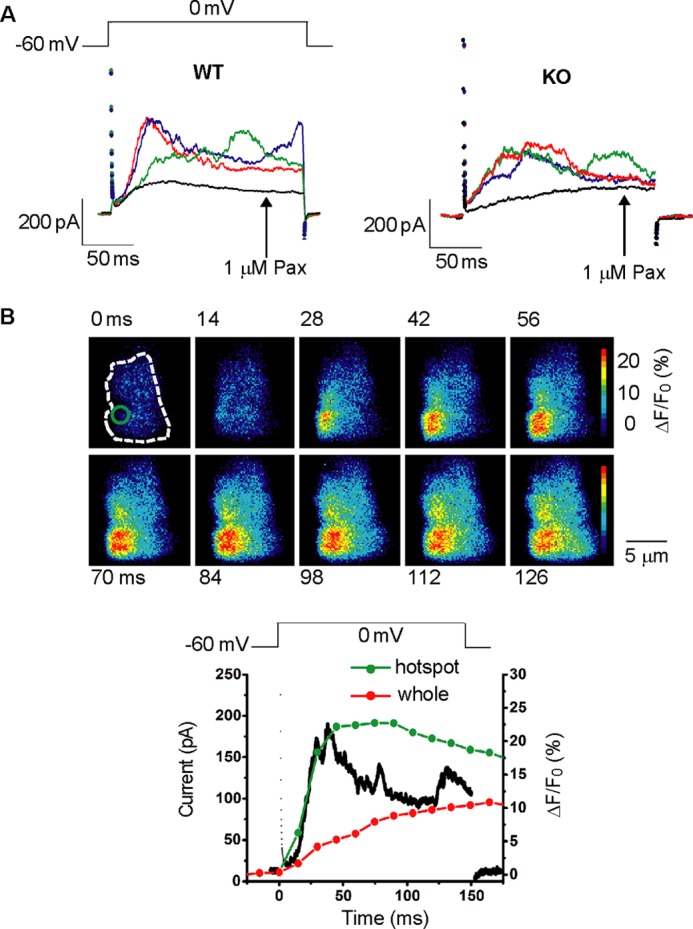
FIGURE 1.

The Ca2+ images and membrane currents during depolarization in mesenteric artery SMCs under whole cell voltage clamp using the low Ca2+ buffer pipette solution. A, the membrane currents upon depolarization from −60 to 0 mV were recorded 3 times with the interval of 15 s from the same cell in the control conditions (left, myocyte from WT mouse; right, myocyte from KO mouse). The black lines indicate the currents after the addition of 1 μm paxiline (Pax). B, single mesenteric artery SMC from WT mouse was depolarized from a holding potential of −60 to 0 mV for 150 ms under the whole cell voltage clamp. The Ca2+ images were simultaneously obtained using the TIRF microscopy system. Images obtained every 14 ms are shown with recording times after the start of depolarization. The Ca2+-indicator fluo-4 was applied from the recording pipette. The dotted line indicates the SMC area attached to the bottom of the recording chamber. Changes in relative fluorescent intensity (ΔF/F0) in the hotspot area indicated by a circle in the image at zero time were plotted against time with the green line. Changes in the average ΔF/F0 from whole cell area are also plotted with the red line. The black line indicates the membrane current.
