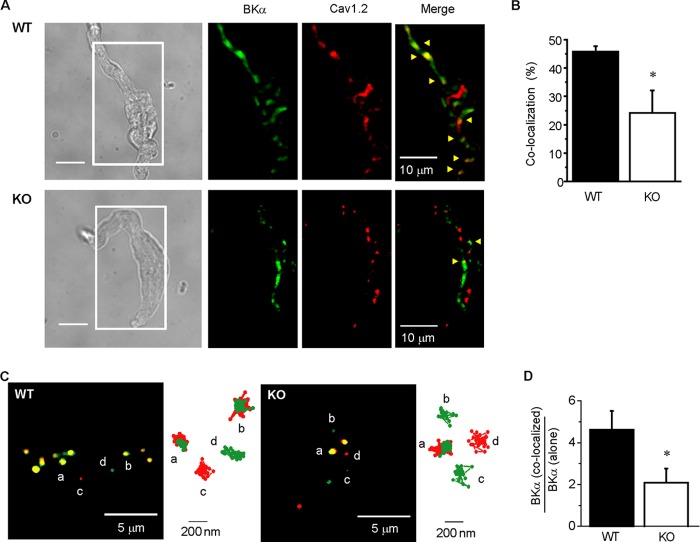
FIGURE 3.
Co-localization of BKCa and Cav1.2 in caveolae in mesenteric arterial SMCs. A, fluorescent labeling of BKα and Cav1.2 in freshly isolated mesenteric SMCs from WT (upper) and KO (lower) mice were visualized using TIRF microscope. The area surrounded by a white line in the transmitted light images (left) are shown as TIRF images. BKα and Cav1.2 were labeled with anti-BKα antibody and DM-BODIPY (−)-dihydropyridine, respectively. Fluorescent signals from particles corresponding to BKα, Cav1.2, and co-localization were shown in green, red, and yellow (indicated by arrowheads), respectively. B, the ratio of BKα and Cav1.2 co-localization particle number to total BKα particle number in WT (n = 8) and KO (n = 7) myocytes (*, p < 0.05). C, typical TIRF images of mesenteric SMCs expressing YFP- or CFP-tagged channels from WT (left) and KO (right) mice were shown (see also supplemental Movies 1 and 2). The green, red, and yellow particles indicate BKα-YFP alone, Cav1.2-CFP alone, and BKα-YFP and Cav1.2-CFP co-localization, respectively. Trajectory of the channel for 60 s is also shown in right of each image. D, the ratio of BKα-YFP and Cav1.2-CFP co-localization to BKα-YFP alone in WT (n = 10) and KO (n = 9) myocytes (*, p < 0.05).

